## Diagram: Directed Graph with Triangular and Circular Nodes
### Overview
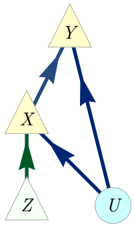
The image depicts a directed graph with four nodes: three triangular shapes (Y, X, Z) and one circular node (U). Arrows indicate directional relationships between nodes, with two colors (blue and green) distinguishing the connections.
### Components/Axes
- **Nodes**:
- **Y**: Yellow triangle at the top center.
- **X**: Yellow triangle at the middle left.
- **Z**: Gray triangle at the bottom left.
- **U**: Light blue circle at the bottom right.
- **Arrows**:
- **Blue arrows**:
- From Y to X (top to middle left).
- From Y to U (top to bottom right).
- **Green arrow**:
- From X to Z (middle left to bottom left).
- **No legend** is present to explicitly define arrow colors or node categories.
### Detailed Analysis
- **Node Placement**:
- Y is spatially dominant, positioned at the apex.
- X and Z form a vertical alignment on the left side, with X above Z.
- U is isolated on the right, receiving input only from Y.
- **Directionality**:
- Y → X and Y → U suggest Y as a source or influencer.
- X → Z implies a downstream relationship from X to Z.
- **Color Coding**:
- Blue arrows may represent primary or direct relationships.
- Green arrow (X → Z) could denote a secondary or specialized connection.
### Key Observations
1. **Central Role of Y**: Y is the only node with outgoing arrows to two other nodes (X and U), suggesting it acts as a hub or initiator.
2. **Isolation of U**: U has no outgoing arrows, indicating it may be a terminal or output node.
3. **Lack of Reciprocity**: No arrows point back to Y, X, or Z, implying a unidirectional flow.
4. **Color Ambiguity**: Without a legend, the significance of blue vs. green arrows remains speculative.
### Interpretation
This diagram likely represents a hierarchical or causal system:
- **Y** could symbolize a root cause, input, or primary variable influencing both **X** (a mediator) and **U** (an output).
- **X**’s connection to **Z** might indicate a secondary process or dependency.
- The absence of feedback loops suggests a linear or acyclic process.
**Uncertainties**:
- The purpose of node colors (yellow for triangles, gray for Z, light blue for U) is unclear.
- Arrow colors lack explicit definitions, limiting interpretation of their functional significance.
This structure could model workflows, decision trees, or dependency graphs in technical systems, though additional context is needed to confirm its application.