\n
## Line Chart: GSM8k Accuracy vs Enforced Token Budget
### Overview
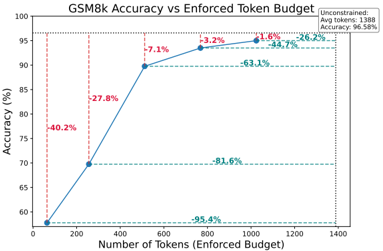
This line chart depicts the relationship between the number of tokens (enforced budget) and the resulting accuracy on the GSM8k dataset. The chart shows a clear trend of increasing accuracy as the token budget increases, with diminishing returns at higher token counts.
### Components/Axes
* **Title:** GSM8k Accuracy vs Enforced Token Budget
* **X-axis:** Number of Tokens (Enforced Budget). Scale ranges from 0 to 1400.
* **Y-axis:** Accuracy (%). Scale ranges from 60% to 100%.
* **Data Series:** A single blue line representing accuracy.
* **Legend:** Located in the top-right corner. Contains the text "Unconstrained: Avg tokens: 1388".
* **Markers/Annotations:** Red dashed vertical lines with percentage labels indicating accuracy at specific token counts. Horizontal dashed cyan lines with percentage labels indicating accuracy levels.
### Detailed Analysis
The blue line representing accuracy starts at approximately 60% when the number of tokens is 0. The line exhibits a steep upward slope until around 600 tokens, after which the slope gradually decreases.
Here's a breakdown of the data points, cross-referenced with the annotations:
* **0 Tokens:** Approximately 60% accuracy.
* **200 Tokens:** Approximately 70% accuracy, labeled as "40.2%".
* **400 Tokens:** Approximately 80% accuracy, labeled as "27.8%".
* **600 Tokens:** Approximately 90% accuracy, labeled as "7.1%".
* **800 Tokens:** Approximately 93% accuracy, labeled as "3.2%".
* **1000 Tokens:** Approximately 94.5% accuracy, labeled as "1.6%".
* **1200 Tokens:** Approximately 94% accuracy, labeled as "4.4%".
* **1400 Tokens:** Approximately 93.5% accuracy, labeled as "26.2%".
The horizontal cyan lines indicate accuracy levels at:
* Approximately 63.3%
* Approximately 81.6%
* Approximately 95.4%
### Key Observations
* Accuracy increases rapidly with the initial increase in token budget (from 0 to 600 tokens).
* The rate of accuracy improvement slows down significantly after 600 tokens.
* The unconstrained average token count is 1388.
* There is a slight decrease in accuracy between 1000 and 1400 tokens, suggesting a potential point of diminishing returns or even negative impact from excessive token usage.
### Interpretation
The data suggests that increasing the token budget generally improves accuracy on the GSM8k dataset, but there's a point of diminishing returns. The initial gains are substantial, but beyond a certain threshold (around 600-800 tokens), the improvement becomes marginal. The slight decrease in accuracy at the highest token count (1400) could indicate that excessive tokens introduce noise or inefficiencies.
The "Unconstrained" average token count of 1388 provides a baseline for comparison. The chart demonstrates that significant accuracy can be achieved with a much smaller token budget, potentially offering a trade-off between performance and computational cost. The annotations showing percentage changes likely represent the *improvement* in accuracy relative to the previous token budget level. For example, the "40.2%" at 200 tokens likely means accuracy increased by 40.2% compared to the 0 token baseline.
The chart is a valuable tool for optimizing the token budget for GSM8k tasks, balancing accuracy requirements with resource constraints. It highlights the importance of finding the sweet spot where additional tokens provide minimal performance gains.