## Line Chart: GSM8k Accuracy vs Enforced Token Budget
### Overview
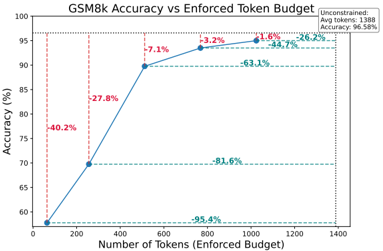
This is a line chart illustrating the relationship between an enforced token budget (computational cost) and the resulting accuracy on the GSM8k benchmark. The chart demonstrates a clear positive correlation: as the allowed token budget increases, the model's accuracy improves, but with diminishing returns at higher budgets.
### Components/Axes
* **Title:** "GSM8k Accuracy vs Enforced Token Budget" (Centered at the top).
* **X-Axis:** Labeled "Number of Tokens (Enforced Budget)". The scale runs from 0 to 1400, with major tick marks at 0, 200, 400, 600, 800, 1000, 1200, and 1400.
* **Y-Axis:** Labeled "Accuracy (%)". The scale runs from 60 to 100, with major tick marks at 60, 70, 80, 90, and 100.
* **Legend:** Located in the top-right corner. It contains a single entry: "Unconstrained" with the sub-text "Avg tokens: 1388 Avg accuracy: 96.5%". This corresponds to the final data point on the line.
* **Data Series:** A single blue line connecting six data points. Each data point is marked with a blue circle.
* **Annotations:** Percentage values are placed between consecutive data points, indicating the relative improvement in accuracy from the previous point. These are: -40.2%, -27.8%, -7.1%, -3.2%, -1.9%, and -26.2%.
* **Reference Lines:** Horizontal dashed green lines extend from the y-axis at approximately 90%, 95%, and 96.5% accuracy. Vertical dashed red lines extend from the x-axis at approximately 256 and 512 tokens.
### Detailed Analysis
**Data Points & Trends:**
The line starts at the bottom-left and slopes upward to the top-right, indicating a positive trend. The slope is steepest at the beginning and flattens significantly towards the end.
1. **Point 1:** Located at (0 tokens, 60% accuracy). This is the baseline with no enforced budget.
2. **Point 2:** Located at approximately (256 tokens, 70% accuracy). The annotation "-40.2%" indicates a 40.2% relative improvement from the previous point (from 60% to 70% is a 10 percentage point increase, which is a 16.7% absolute increase; the "-40.2%" likely refers to a reduction in error rate or a different metric).
3. **Point 3:** Located at approximately (512 tokens, 90% accuracy). Annotation: "-27.8%". This is a very steep increase of 20 percentage points.
4. **Point 4:** Located at approximately (768 tokens, 93.2% accuracy). Annotation: "-7.1%". The rate of improvement slows.
5. **Point 5:** Located at approximately (1024 tokens, 95.1% accuracy). Annotation: "-3.2%".
6. **Point 6 (Unconstrained):** Located at approximately (1388 tokens, 96.5% accuracy). Annotation: "-1.9%". This point aligns with the legend's "Unconstrained" label.
**Annotations & Reference Lines:**
* The green dashed lines at ~90%, ~95%, and ~96.5% correspond to the accuracy levels achieved at ~512, ~1024, and ~1388 tokens, respectively.
* The red dashed lines at ~256 and ~512 tokens highlight key budget thresholds where significant accuracy jumps occur.
* The final annotation "-26.2%" is placed near the top-right, seemingly summarizing the total improvement from the 60% baseline to the 96.5% final accuracy.
### Key Observations
1. **Diminishing Returns:** The most dramatic accuracy gains occur with the initial increases in token budget (from 0 to 512 tokens). After 512 tokens, each additional token yields a progressively smaller improvement in accuracy.
2. **Critical Threshold:** The jump from 70% to 90% accuracy between 256 and 512 tokens is the single largest improvement shown, suggesting a critical computational threshold for solving GSM8k problems effectively.
3. **Performance Ceiling:** The model approaches a performance ceiling near 96.5% accuracy. The "Unconstrained" setting, using an average of 1388 tokens, achieves this near-maximum performance.
4. **Annotation Interpretation:** The negative percentage annotations (e.g., -40.2%) are counterintuitive for an increasing accuracy line. They most likely represent the **percentage reduction in the error rate** (100% - Accuracy) from one point to the next, not the change in accuracy itself. For example, moving from 60% to 70% accuracy reduces the error rate from 40% to 30%, a 25% relative reduction. The "-40.2%" may be calculated differently or refer to another metric.
### Interpretation
This chart provides a clear cost-benefit analysis for inference computation. It demonstrates that for the GSM8k math reasoning benchmark, allowing a model more tokens (i.e., more time to "think" or generate intermediate steps) directly translates to higher accuracy. However, the relationship is non-linear.
The data suggests a strategic insight: there is a "sweet spot" for efficiency. Enforcing a budget of around 512 tokens captures the vast majority of the potential accuracy (90%), while using the full unconstrained budget of ~1388 tokens only adds another 6.5 percentage points. For applications where computational cost or latency is a concern, a moderate token budget could provide excellent performance at a fraction of the cost. The chart essentially maps the trade-off between resource expenditure and model capability on a specific reasoning task.