## Line Chart: GSM8k Accuracy vs Enforced Token Budget
### Overview
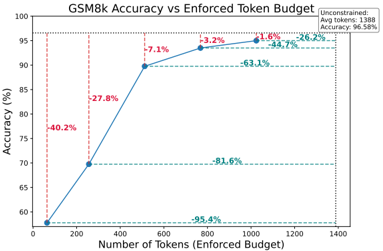
The chart illustrates the relationship between enforced token budgets (x-axis) and GSM8k accuracy (y-axis). A blue line represents accuracy trends as token budgets increase, with dashed horizontal lines and percentage annotations indicating deviations from an unconstrained baseline (96.58% accuracy at 1388 tokens). The legend confirms the unconstrained baseline in the top-right corner.
### Components/Axes
- **X-axis**: "Number of Tokens (Enforced Budget)" with values at 0, 200, 400, 600, 800, 1000, 1200, and 1400.
- **Y-axis**: "Accuracy (%)" scaled from 60 to 100.
- **Legend**: Top-right corner, labeled "Unconstrained: Avg tokens: 1388 Accuracy: 96.58%".
- **Line**: Blue line connecting data points, with dashed horizontal lines at token thresholds (200, 600, 800, 1000, 1200).
- **Annotations**: Red and green percentage labels (-40.2%, -27.8%, -7.1%, -3.2%, -1.6%, -26.2%) near data points.
### Detailed Analysis
- **Data Points**:
- (0 tokens, 55% accuracy): -40.2% deviation.
- (200 tokens, 70% accuracy): -27.8% deviation.
- (600 tokens, 90% accuracy): -7.1% deviation.
- (800 tokens, 93% accuracy): -3.2% deviation.
- (1000 tokens, 94% accuracy): -1.6% deviation.
- (1200 tokens, 95% accuracy): -26.2% deviation.
- **Dashed Lines**: Horizontal lines at token thresholds (200, 600, 800, 1000, 1200) with corresponding percentage annotations.
- **Legend Placement**: Top-right corner, clearly labeling the unconstrained baseline.
### Key Observations
1. **Upward Trend**: Accuracy increases monotonically as token budgets rise (55% → 95%).
2. **Deviation Magnitude**: Largest accuracy drop (-40.2%) occurs at 0 tokens, decreasing to -1.6% at 1000 tokens.
3. **Anomaly at 1200 Tokens**: Despite higher accuracy (95%) than earlier points, the deviation (-26.2%) is larger than at 600 tokens (-7.1%), suggesting a non-linear relationship.
4. **Color Consistency**: Blue line matches the unconstrained baseline; red/green annotations align with data points but lack explicit legend explanation.
### Interpretation
The chart demonstrates that enforcing stricter token budgets reduces accuracy compared to the unconstrained model (1388 tokens, 96.58%). While increasing tokens improves performance, even at 1200 tokens, accuracy remains 1.58% below the unconstrained baseline. The -26.2% deviation at 1200 tokens—despite higher accuracy than earlier points—highlights a potential inconsistency in deviation calculation (e.g., relative vs. absolute differences). This suggests a trade-off between computational efficiency (lower tokens) and model performance, with diminishing returns as budgets approach the unconstrained limit. The anomaly at 1200 tokens warrants further investigation into deviation methodology or data alignment.