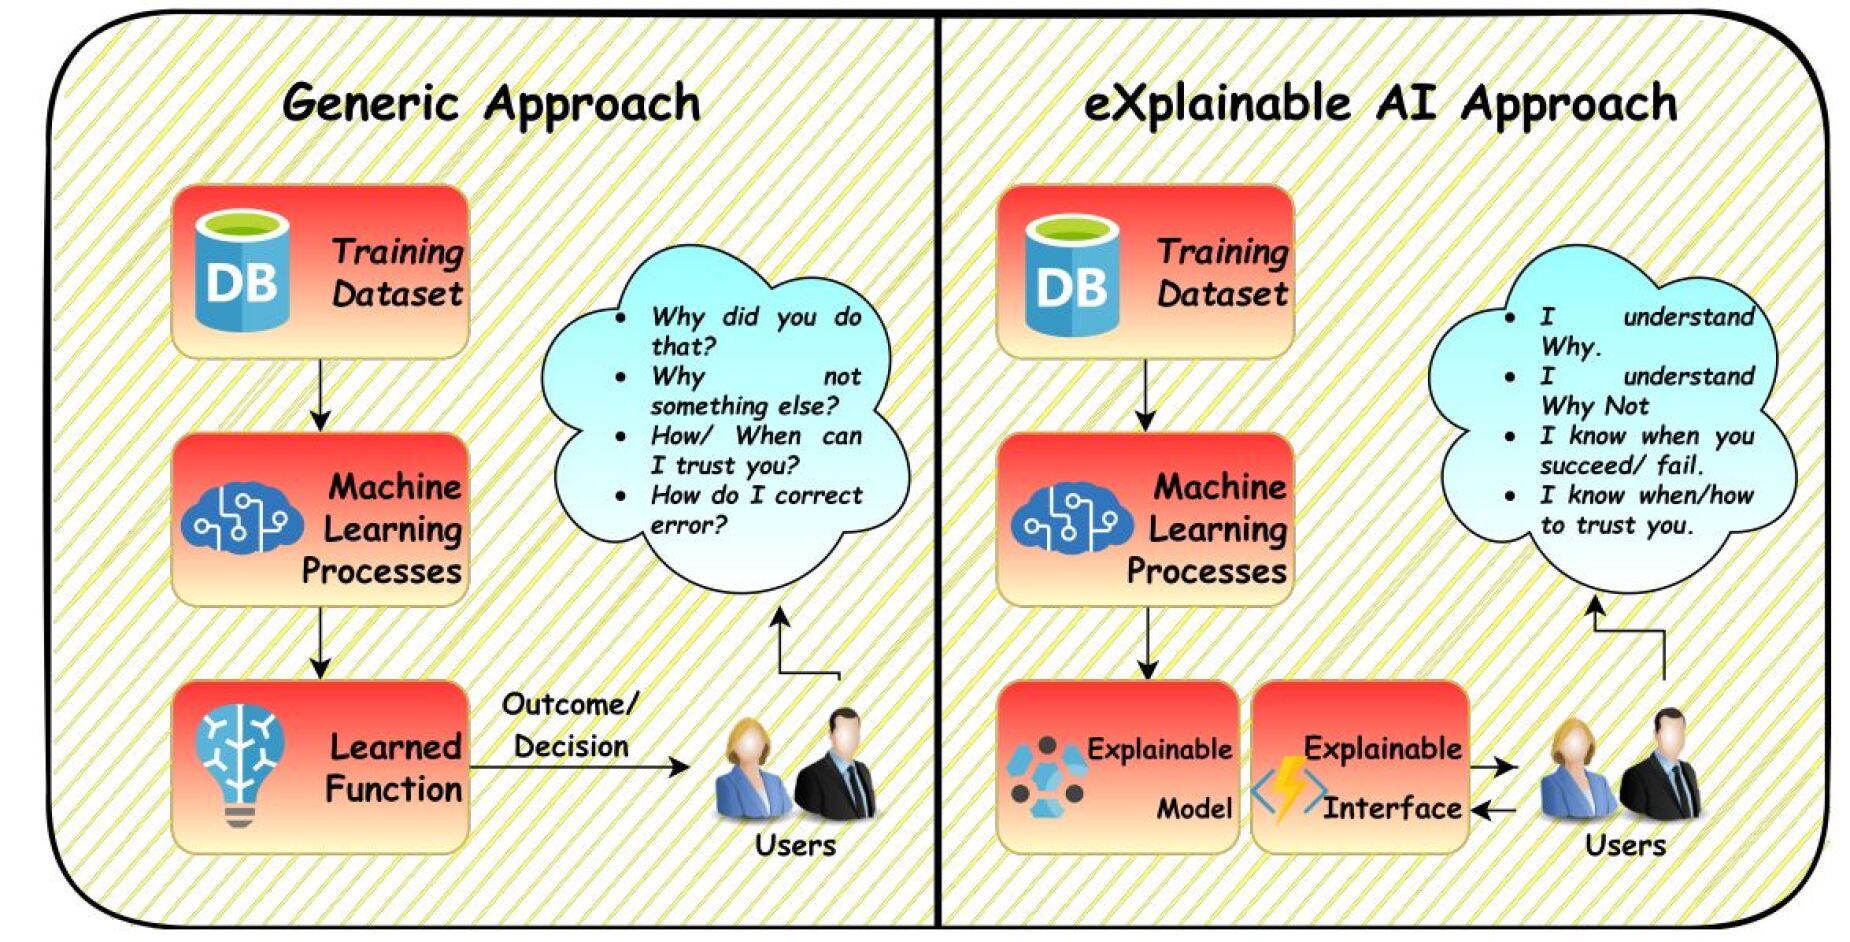
## Diagram: Comparison of Generic vs. eXplainable AI Approaches
### Overview
The diagram contrasts two AI workflows: a **Generic Approach** and an **eXplainable AI (XAI) Approach**. Both start with a **Training Dataset (DB)** and **Machine Learning Processes**, but diverge in their handling of outcomes and user interaction. The Generic Approach produces a **Learned Function** leading to an **Outcome/Decision**, while the XAI Approach introduces an **Explainable Model** and **Explainable Interface** to enhance transparency.
### Components/Axes
1. **Left Side (Generic Approach)**:
- **Training Dataset (DB)**: Input for Machine Learning Processes.
- **Machine Learning Processes**: Processes data to generate a **Learned Function**.
- **Learned Function**: Outputs an **Outcome/Decision**.
- **Users**: Interact with the system, raising questions about trust, errors, and decisions.
2. **Right Side (eXplainable AI Approach)**:
- **Training Dataset (DB)**: Same input as the Generic Approach.
- **Machine Learning Processes**: Processes data to generate an **Explainable Model**.
- **Explainable Model**: Feeds into an **Explainable Interface**.
- **Explainable Interface**: Provides transparency to **Users**, who now express confidence in understanding decisions and trust.
3. **Thought Bubbles**:
- **Generic Approach Users**: Ask questions like *"Why did you do that?"* and *"How can I trust you?"*.
- **XAI Approach Users**: State confidence: *"I understand why,"* *"I know when you succeed/fail,"* and *"I know how to trust you."*
### Detailed Analysis
- **Training Dataset (DB)**: Positioned at the top of both workflows, serving as the foundational input for Machine Learning Processes.
- **Machine Learning Processes**: Central to both approaches, but the Generic Approach lacks mechanisms for transparency.
- **Learned Function (Generic)**: A black-box output leading to user skepticism (e.g., *"Why not something else?"*).
- **Explainable Model/Interface (XAI)**: Adds layers of interpretability, addressing user concerns through explicit explanations.
- **User Interaction**:
- Generic users focus on distrust and error correction.
- XAI users emphasize understanding, trust, and accountability.
### Key Observations
1. **Transparency Gap**: The Generic Approach lacks mechanisms to explain decisions, leading to user uncertainty.
2. **Trust Building**: The XAI Approach directly addresses user concerns via the Explainable Interface, fostering confidence.
3. **Workflow Complexity**: The XAI Approach introduces additional steps (Explainable Model → Interface) but improves user-system interaction.
### Interpretation
The diagram underscores the importance of **explainability** in AI systems. While the Generic Approach prioritizes efficiency, it risks alienating users due to opacity. The XAI Approach, though more complex, aligns with ethical AI principles by enabling users to:
- Understand decision logic (*"I understand why"*).
- Assess reliability (*"I know when you succeed/fail"*).
- Build trust through accountability (*"I know how to trust you"*).
This highlights a trade-off between simplicity and transparency, with XAI offering a pathway to responsible AI adoption in user-centric applications.