\n
## Bar Chart: Pairwise Comparison Win Rates
### Overview
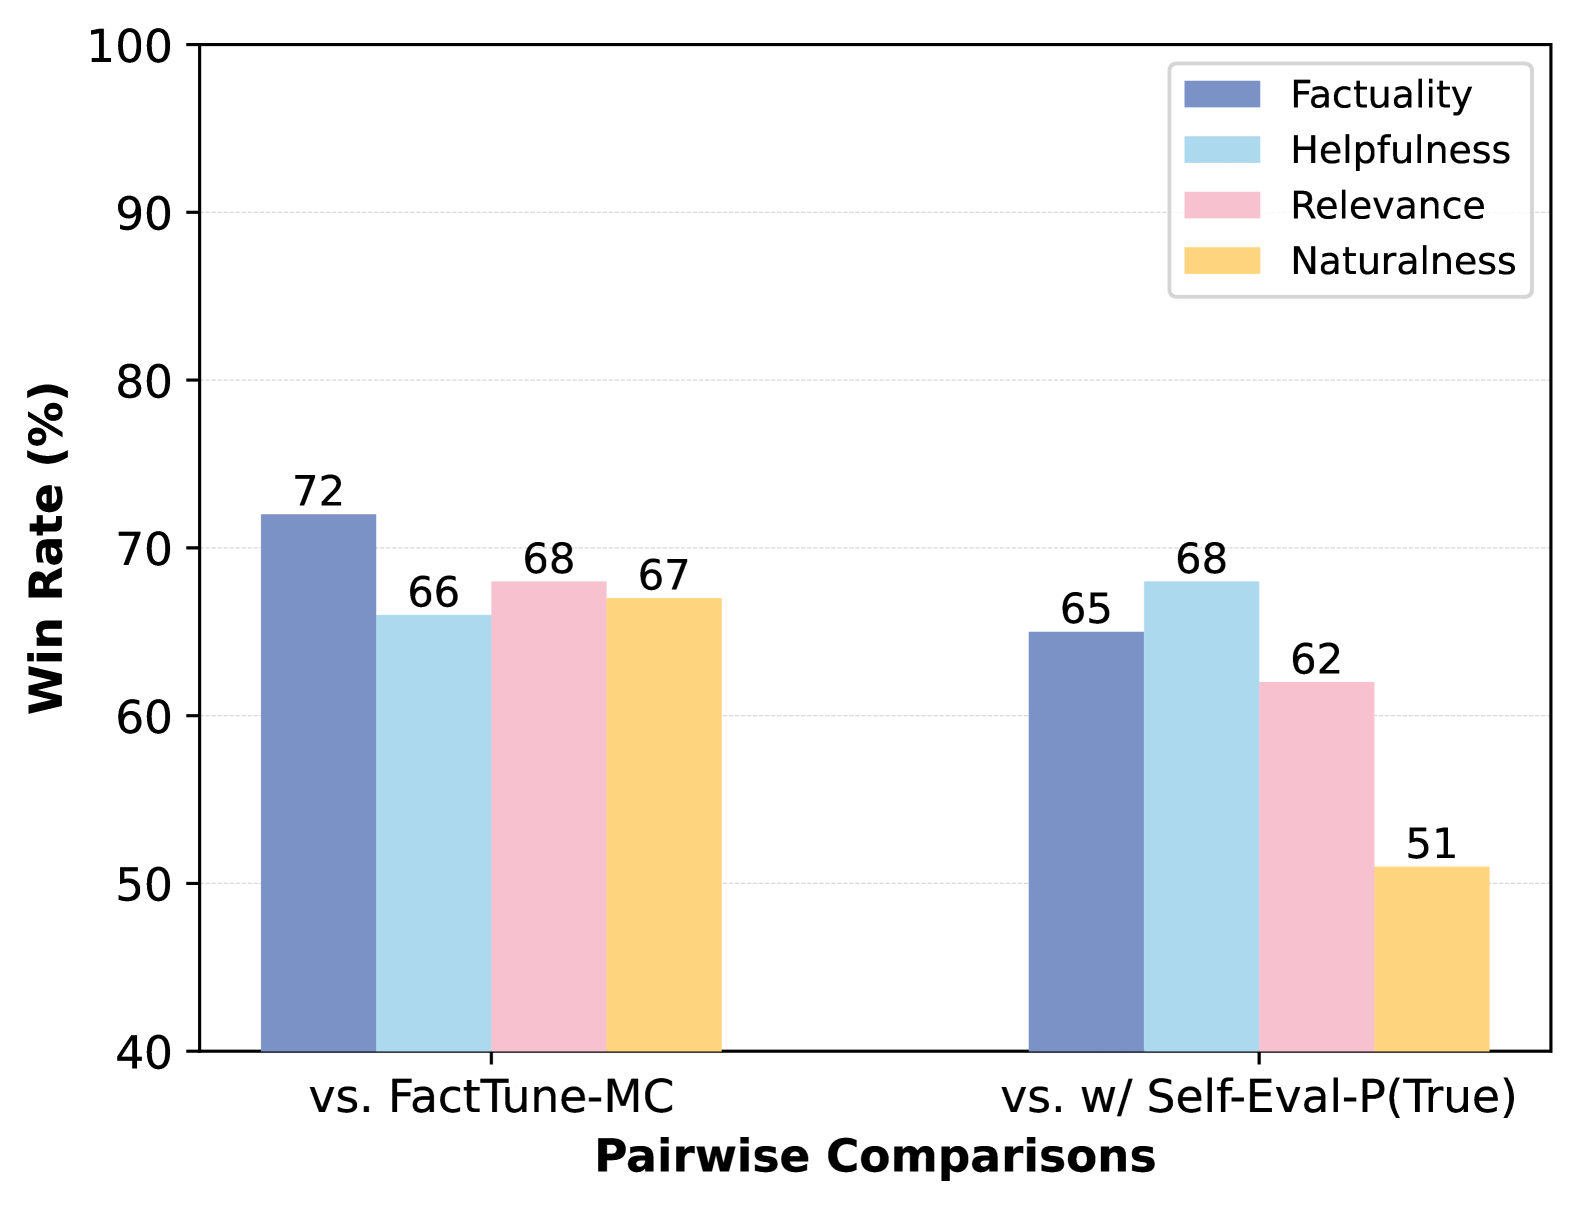
This bar chart compares the win rates of two models, FactTune-MC and w/ Self-Eval-P(True), across four evaluation metrics: Factuality, Helpfulness, Relevance, and Naturalness. The win rate is expressed as a percentage and is shown for each metric in a pairwise comparison.
### Components/Axes
* **X-axis:** "Pairwise Comparisons" with two categories: "vs. FactTune-MC" and "vs. w/ Self-Eval-P(True)".
* **Y-axis:** "Win Rate (%)" ranging from 40 to 100, with increments of 10.
* **Legend:** Located in the top-right corner, defining the color-coding for each metric:
* Factuality (Blue)
* Helpfulness (Light Blue)
* Relevance (Pink)
* Naturalness (Yellow)
### Detailed Analysis
The chart consists of two groups of four bars, one for each pairwise comparison.
**vs. FactTune-MC:**
* **Factuality:** The blue bar representing Factuality has a height of approximately 72%.
* **Helpfulness:** The light blue bar representing Helpfulness has a height of approximately 66%.
* **Relevance:** The pink bar representing Relevance has a height of approximately 68%.
* **Naturalness:** The yellow bar representing Naturalness has a height of approximately 67%.
**vs. w/ Self-Eval-P(True):**
* **Factuality:** The blue bar representing Factuality has a height of approximately 65%.
* **Helpfulness:** The light blue bar representing Helpfulness has a height of approximately 68%.
* **Relevance:** The pink bar representing Relevance has a height of approximately 62%.
* **Naturalness:** The yellow bar representing Naturalness has a height of approximately 51%.
### Key Observations
* When compared to FactTune-MC, the model consistently achieves win rates above 66% across all metrics, with Factuality having the highest win rate at 72%.
* When compared to w/ Self-Eval-P(True), the win rates are generally lower, particularly for Naturalness (51%).
* Factuality consistently shows a relatively high win rate in both comparisons.
* Naturalness shows the lowest win rate when compared to w/ Self-Eval-P(True).
### Interpretation
The data suggests that the model performs better against FactTune-MC than against w/ Self-Eval-P(True) across all evaluated metrics. The consistently high win rate for Factuality indicates that the model excels in generating factually correct outputs. The lower win rate for Naturalness against w/ Self-Eval-P(True) suggests that the latter model may produce more natural-sounding responses. The differences in win rates could be due to the inherent strengths of each model in different aspects of language generation. The chart highlights the trade-offs between different evaluation metrics and suggests that optimizing for one metric may come at the expense of others. The pairwise comparison approach provides a direct assessment of the relative performance of the models, offering valuable insights for model development and selection.