## Bar Chart: Pairwise Comparisons of Model Performance Metrics
### Overview
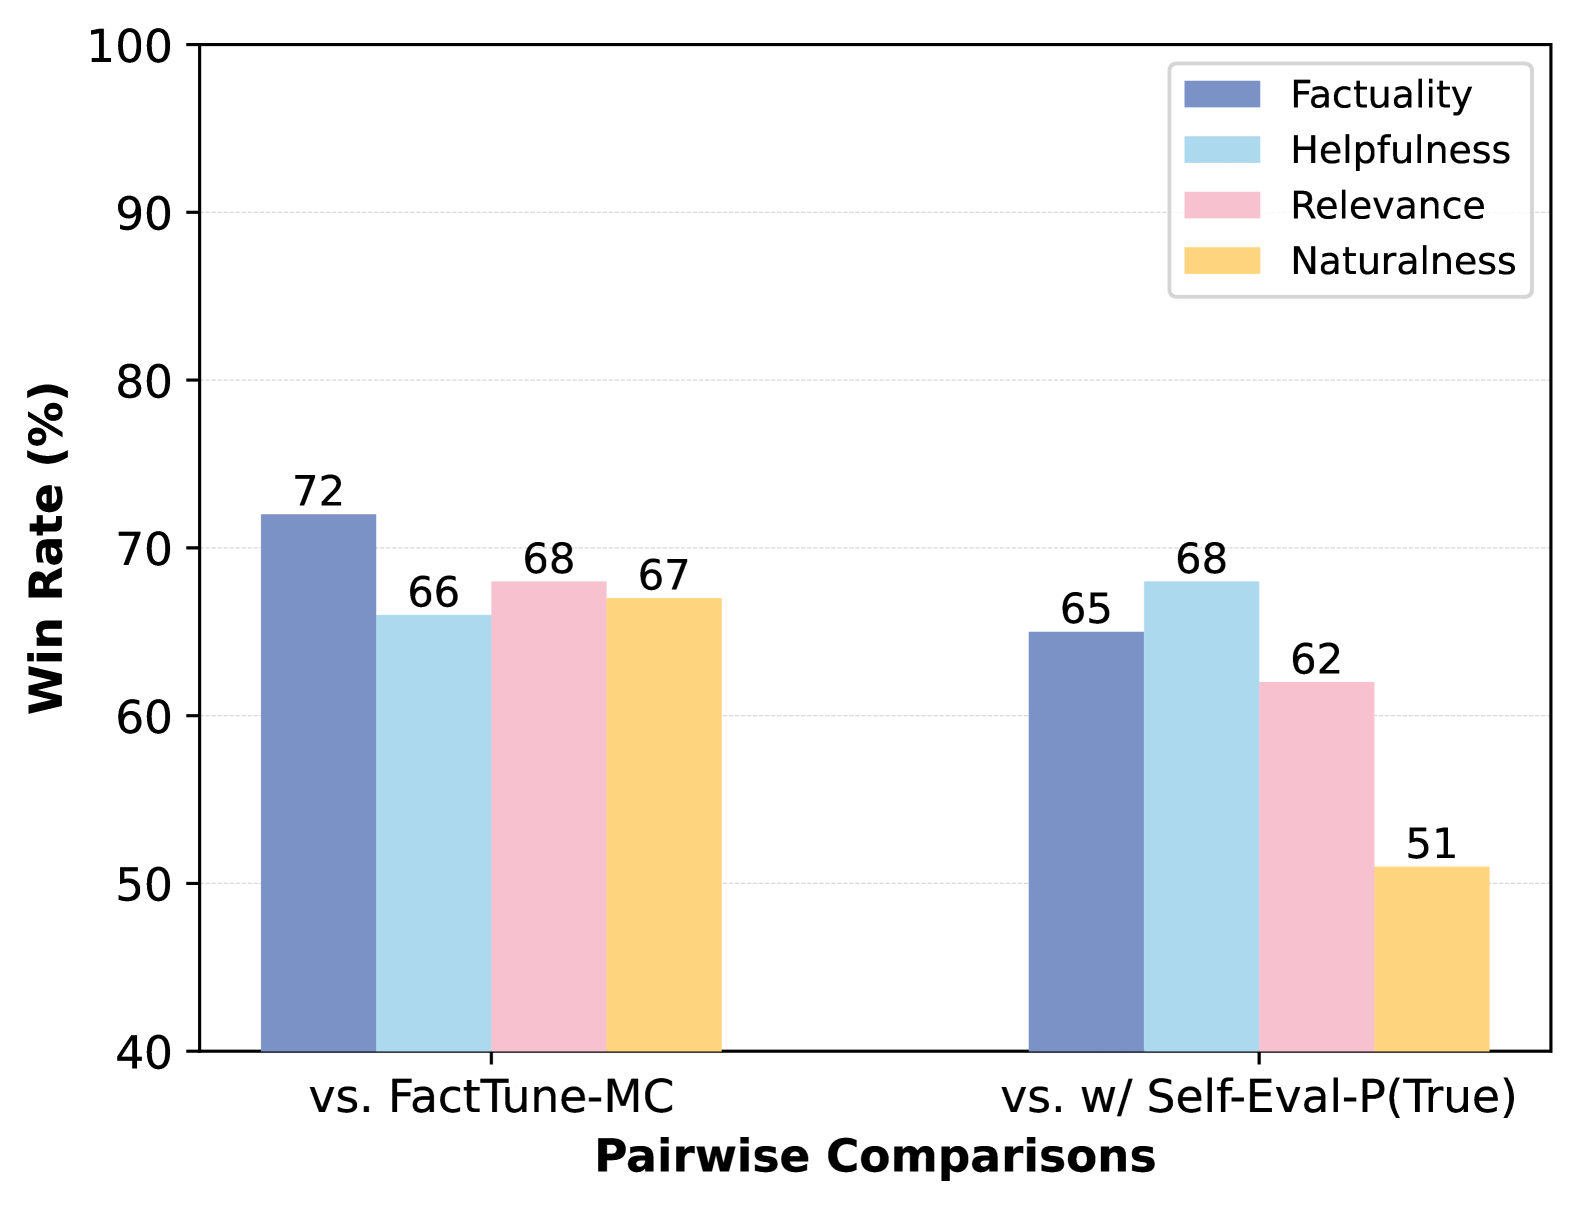
The chart compares win rates (%) of four evaluation metrics (Factuality, Helpfulness, Relevance, Naturalness) across two model configurations: "vs. FactTune-MC" and "vs. w/ Self-Eval-P(True)". Metrics are color-coded, with vertical bars representing performance differences between configurations.
### Components/Axes
- **X-axis**: Pairwise Comparisons (Categorical: "vs. FactTune-MC", "vs. w/ Self-Eval-P(True)")
- **Y-axis**: Win Rate (%) (Quantitative: 40–100, linear scale)
- **Legend**: Located in top-right corner, mapping colors to metrics:
- Blue: Factuality
- Light Blue: Helpfulness
- Pink: Relevance
- Yellow: Naturalness
### Detailed Analysis
#### vs. FactTune-MC Group
- **Factuality** (Blue): 72% win rate
- **Helpfulness** (Light Blue): 66% win rate
- **Relevance** (Pink): 68% win rate
- **Naturalness** (Yellow): 67% win rate
#### vs. w/ Self-Eval-P(True) Group
- **Factuality** (Blue): 65% win rate
- **Helpfulness** (Light Blue): 68% win rate
- **Relevance** (Pink): 62% win rate
- **Naturalness** (Yellow): 51% win rate
### Key Observations
1. **Factuality Dominance**: The "vs. FactTune-MC" group shows the highest Factuality win rate (72%), while "vs. w/ Self-Eval-P(True)" has the lowest (65%).
2. **Naturalness Anomaly**: Naturalness performance drops sharply in the "vs. w/ Self-Eval-P(True)" group (51% vs. 67% in the other group).
3. **Helpfulness Paradox**: The "vs. w/ Self-Eval-P(True)" group outperforms FactTune-MC in Helpfulness (68% vs. 66%).
4. **Relevance Decline**: Relevance win rate decreases by 6 percentage points when comparing the two groups (68% → 62%).
### Interpretation
The data suggests that:
- **FactTune-MC** excels in factual accuracy but lags slightly in Helpfulness compared to the Self-Eval-P(True) variant.
- The **Naturalness metric** is highly sensitive to evaluation methodology, with Self-Eval-P(True) showing a 24% relative decline.
- The **Helpfulness advantage** of Self-Eval-P(True) might stem from its ability to generate more contextually appropriate responses, despite lower Naturalness scores.
- The **Relevance drop** in Self-Eval-P(True) could indicate over-optimization for factual correctness at the expense of topical alignment.
### Spatial Grounding & Trend Verification
- Legend colors match bar colors exactly (e.g., blue bars = Factuality).
- Vertical bar heights align with y-axis scaling (e.g., 72% ≈ 70–75% range).
- No overlapping categories or ambiguous groupings observed.