\n
## Line Chart: Rouge-L Score vs. Steps
### Overview
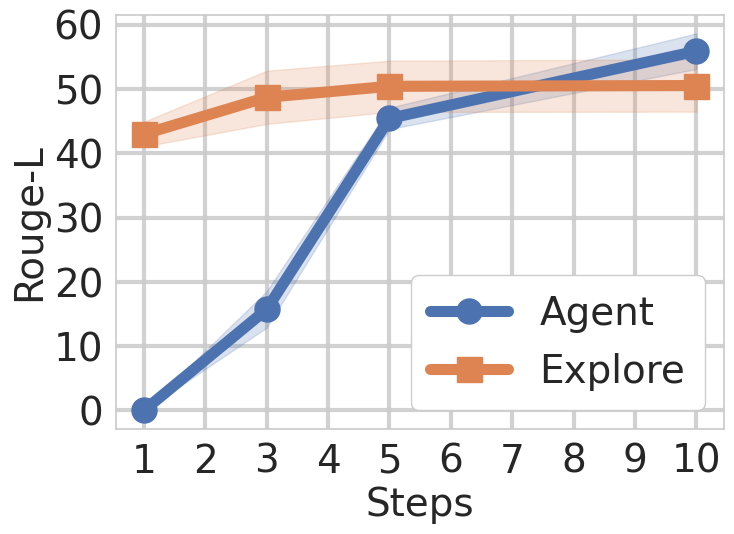
This image presents a line chart comparing the Rouge-L scores of two methods, "Agent" and "Explore", across 10 steps. The chart visualizes the performance of each method as the number of steps increases. Shaded areas around each line represent the standard deviation or confidence interval.
### Components/Axes
* **X-axis:** "Steps", ranging from 1 to 10, with tick marks at each integer value.
* **Y-axis:** "Rouge-L", ranging from 0 to 60, with tick marks at intervals of 10.
* **Data Series 1:** "Agent" - Represented by a blue line with circular data points.
* **Data Series 2:** "Explore" - Represented by an orange line with triangular data points.
* **Legend:** Located in the bottom-right corner, identifying the lines as "Agent" (blue) and "Explore" (orange).
### Detailed Analysis
**Agent (Blue Line):**
The "Agent" line starts at approximately 1 on Step 1 and exhibits a generally upward trend.
* Step 1: ~1
* Step 2: ~8
* Step 3: ~15
* Step 4: ~38
* Step 5: ~45
* Step 6: ~48
* Step 7: ~50
* Step 8: ~52
* Step 9: ~55
* Step 10: ~57
**Explore (Orange Line):**
The "Explore" line starts at approximately 43 on Step 1 and shows a more gradual upward trend, with some fluctuations.
* Step 1: ~43
* Step 2: ~46
* Step 3: ~49
* Step 4: ~50
* Step 5: ~51
* Step 6: ~51
* Step 7: ~52
* Step 8: ~52
* Step 9: ~52
* Step 10: ~52
The shaded areas around each line indicate variability. The "Agent" line has a wider shaded area in the earlier steps (1-4), suggesting greater variance in performance. The "Explore" line has a relatively consistent shaded area throughout.
### Key Observations
* The "Agent" method demonstrates a significant increase in Rouge-L score between Steps 3 and 4, indicating a rapid improvement in performance.
* The "Explore" method shows a more stable, but less dramatic, increase in Rouge-L score.
* By Step 10, the "Agent" method has a Rouge-L score of approximately 57, while the "Explore" method has a score of approximately 52.
* The "Explore" method consistently outperforms the "Agent" method in the initial steps (1-3).
### Interpretation
The chart suggests that the "Agent" method, while initially slower to improve, eventually surpasses the "Explore" method in terms of Rouge-L score as the number of steps increases. This could indicate that the "Agent" method requires a certain number of steps to "learn" or adapt, after which it achieves higher performance. The "Explore" method provides a more consistent, but ultimately lower, level of performance. The shaded areas suggest that the "Agent" method's performance is more variable, particularly in the early stages, potentially due to a more exploratory or unstable learning process. The Rouge-L metric is commonly used to evaluate the quality of text summarization or generation, so this chart likely represents the performance of two different algorithms or strategies in a natural language processing task.