## Chart: EFE1 Trajectory Plot
### Overview
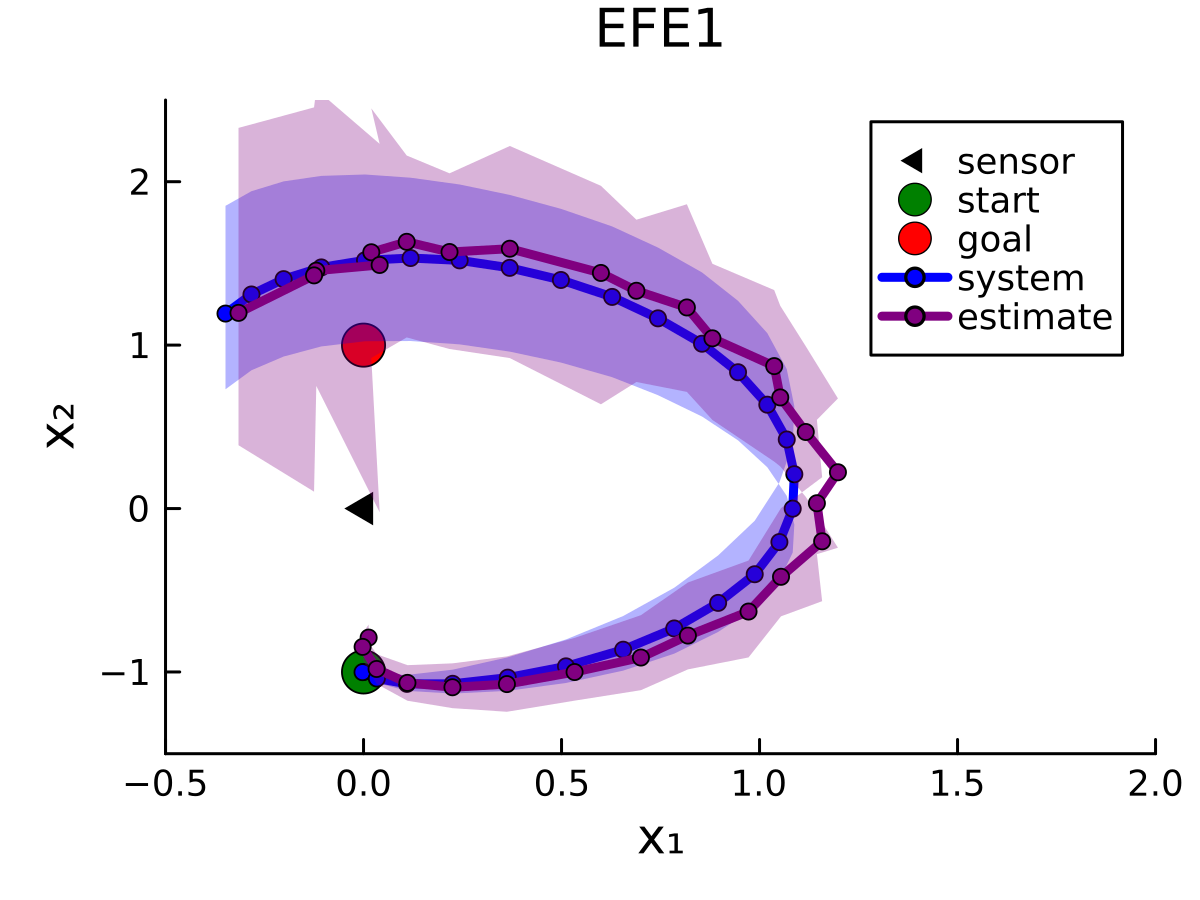
This image displays a 2D state-space plot, titled "EFE1," representing the trajectory of a system and an associated estimate as they move from a starting point to a goal point. The plot includes a fixed sensor location and shaded regions representing uncertainty (variance) for both the system and the estimate.
### Components/Axes
* **Title:** "EFE1" (centered at the top).
* **X-Axis:** Labeled "X1", with a scale ranging from -0.5 to 2.0.
* **Y-Axis:** Labeled "X2", with a scale ranging from -1.5 to 2.5.
* **Legend (Position: Top-Right):**
* **Black Triangle:** "sensor"
* **Green Circle:** "start"
* **Red Circle:** "goal"
* **Blue Line with Blue Circles:** "system"
* **Purple Line with Purple Circles:** "estimate"
### Detailed Analysis
#### Spatial Grounding and Markers
* **Sensor:** Located at coordinates (0, 0).
* **Start:** Located at coordinates (0, -1).
* **Goal:** Located at coordinates (0, 1).
#### Trajectory Trends
* **System (Blue Line):**
* **Trend:** The line originates at the "start" (0, -1), curves smoothly to the right, reaching a maximum X1 value of approximately 1.1, then curves upward and back to the left, terminating near the "goal" (0, 1).
* **Uncertainty:** The blue shaded region follows the path of the line. It is relatively narrow and consistent, indicating low variance in the system's state.
* **Estimate (Purple Line):**
* **Trend:** The line originates near the "start" (0, -1). It follows a path similar to the "system" line but is consistently offset to the right. It reaches a maximum X1 value of approximately 1.2 before curving back toward the "goal" (0, 1).
* **Uncertainty:** The purple shaded region is significantly wider and more irregular (jagged) than the blue region. This indicates a much higher level of uncertainty or variance in the estimation process compared to the system's actual state.
### Key Observations
* **Systematic Offset:** The "estimate" line consistently tracks to the right of the "system" line, suggesting a persistent bias or lag in the estimation model.
* **Uncertainty Disparity:** The "estimate" uncertainty (purple) is substantially larger than the "system" uncertainty (blue). The purple shaded area is particularly wide at the beginning and the peak of the trajectory, suggesting the estimator is less confident during the initial phase and the turn.
* **Navigation:** Both trajectories appear to be navigating around the "sensor" located at (0, 0), forming a "C" or "U" shape rotated 90 degrees clockwise.
### Interpretation
This plot is characteristic of control theory, robotics, or active inference simulations (EFE likely stands for "Expected Free Energy").
* **The Relationship:** The "system" represents the ground truth or the intended path, while the "estimate" represents the agent's internal model or filter output attempting to track that path.
* **The Discrepancy:** The fact that the "estimate" is offset from the "system" and possesses higher uncertainty suggests that the agent is operating under imperfect information or a noisy observation model.
* **Peircean Investigative View:** The "sensor" at (0,0) acts as a landmark or potential obstacle. The trajectories curve away from this point, implying the agent is maintaining a safety margin or is being influenced by the sensor's position. The widening of the purple uncertainty region at the peak of the curve (where X1 is highest) suggests that the agent's predictive model struggles most when the system is furthest from the start/goal axis, indicating a potential non-linearity in the system dynamics that the estimator is struggling to resolve.