## Line Chart: Similarity vs. Reasoning Step for Different Models
### Overview
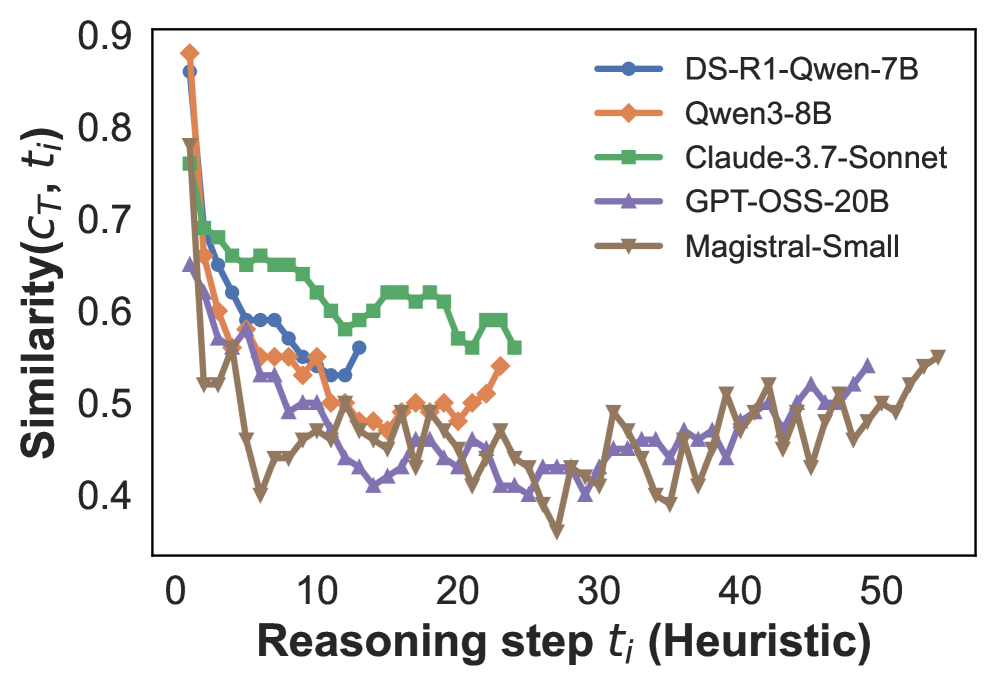
The image is a line chart comparing the similarity scores of five different language models across a series of reasoning steps. The x-axis represents the reasoning step (heuristic), and the y-axis represents the similarity score. Each model is represented by a different colored line with a distinct marker.
### Components/Axes
* **X-axis:** Reasoning step *t<sub>i</sub>* (Heuristic). Scale ranges from 0 to 50, with tick marks every 10 units.
* **Y-axis:** Similarity(*C<sub>T</sub>*, *t<sub>i</sub>*). Scale ranges from 0.4 to 0.9, with tick marks every 0.1 units.
* **Legend:** Located in the top-right corner, identifying each model by color and name:
* Blue with circle markers: DS-R1-Qwen-7B
* Orange with diamond markers: Qwen3-8B
* Green with square markers: Claude-3.7-Sonnet
* Purple with triangle markers: GPT-OSS-20B
* Brown with inverted triangle markers: Magistral-Small
### Detailed Analysis
* **DS-R1-Qwen-7B (Blue, Circle):** Starts at approximately 0.67 at step 0, decreases to around 0.52 by step 10, and then fluctuates between 0.52 and 0.56 until step 50.
* Step 0: ~0.67
* Step 10: ~0.52
* Step 50: ~0.56
* **Qwen3-8B (Orange, Diamond):** Starts at approximately 0.88 at step 0, decreases to around 0.48 by step 10, then increases and fluctuates between 0.45 and 0.52 until step 50.
* Step 0: ~0.88
* Step 10: ~0.48
* Step 20: ~0.50
* Step 50: ~0.52
* **Claude-3.7-Sonnet (Green, Square):** Starts at approximately 0.78 at step 0, decreases to around 0.62 by step 5, then fluctuates between 0.55 and 0.63 until step 25, after which the data ends.
* Step 0: ~0.78
* Step 5: ~0.62
* Step 25: ~0.55
* **GPT-OSS-20B (Purple, Triangle):** Starts at approximately 0.65 at step 0, decreases to around 0.42 by step 10, then fluctuates between 0.38 and 0.55 until step 50.
* Step 0: ~0.65
* Step 10: ~0.42
* Step 30: ~0.40
* Step 50: ~0.55
* **Magistral-Small (Brown, Inverted Triangle):** Starts at approximately 0.52 at step 0, decreases to around 0.40 by step 5, then fluctuates between 0.38 and 0.55 until step 50.
* Step 0: ~0.52
* Step 5: ~0.40
* Step 30: ~0.42
* Step 50: ~0.55
### Key Observations
* All models except Claude-3.7-Sonnet show a significant drop in similarity score within the first 10 reasoning steps.
* Claude-3.7-Sonnet maintains a relatively higher similarity score compared to the other models, but its data is only available up to step 25.
* GPT-OSS-20B and Magistral-Small exhibit similar performance, with overlapping fluctuations in similarity scores.
* After the initial drop, the similarity scores of all models tend to fluctuate within a narrower range.
### Interpretation
The chart illustrates how the similarity between a model's reasoning process and a target solution changes as the model progresses through reasoning steps. The initial drop in similarity suggests that the models initially diverge from the target solution. The subsequent fluctuations indicate that the models are exploring different reasoning paths, with varying degrees of similarity to the target. Claude-3.7-Sonnet's higher initial similarity and slower decline may indicate a more robust or aligned reasoning process, at least for the initial steps. The convergence of GPT-OSS-20B and Magistral-Small suggests that these models may be employing similar reasoning strategies. The data suggests that the models' reasoning processes become less similar to the target solution as the number of reasoning steps increases, highlighting the challenge of maintaining alignment in complex reasoning tasks.