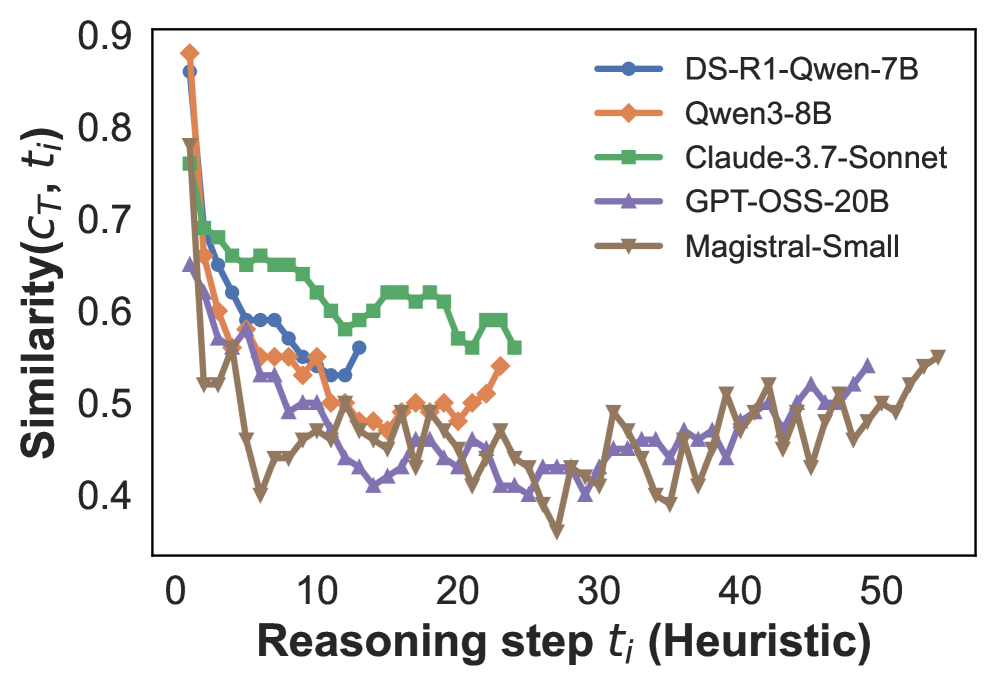
## Line Chart: Similarity of Reasoning Steps
### Overview
This image presents a line chart illustrating the similarity between reasoning steps (represented by *t<sub>i</sub>*) and a target (*C<sub>T</sub>*) for five different language models: DS-R1-Qwen-7B, Qwen-8B, Claude-3.7-Sonnet, GPT-OSS-20B, and Magistral-Small. The chart tracks how this similarity changes as the reasoning step number increases from 0 to approximately 52.
### Components/Axes
* **X-axis:** "Reasoning step *t<sub>i</sub>* (Heuristic)", ranging from 0 to 52.
* **Y-axis:** "Similarity(*C<sub>T</sub>*, *t<sub>i</sub>*)", ranging from 0.4 to 0.9.
* **Legend:** Located in the top-right corner, identifying each line with a specific model name and color.
* DS-R1-Qwen-7B (Blue)
* Qwen-8B (Orange)
* Claude-3.7-Sonnet (Green)
* GPT-OSS-20B (Purple)
* Magistral-Small (Brown)
### Detailed Analysis
Here's a breakdown of each line's trend and approximate data points, verifying color consistency with the legend:
* **DS-R1-Qwen-7B (Blue):** The line starts at approximately 0.85 at step 0, rapidly decreases to around 0.55 by step 10, then fluctuates between 0.45 and 0.55 for the remainder of the steps, showing some oscillation.
* **Qwen-8B (Orange):** This line begins at approximately 0.88 at step 0, drops sharply to around 0.5 by step 10, and then exhibits a more erratic pattern, oscillating between approximately 0.4 and 0.6. It ends at around 0.55 at step 52.
* **Claude-3.7-Sonnet (Green):** Starts at approximately 0.75 at step 0, decreases to around 0.6 by step 10, and then remains relatively stable, fluctuating between 0.58 and 0.65 for the majority of the steps. It ends at approximately 0.62 at step 52.
* **GPT-OSS-20B (Purple):** Begins at approximately 0.7 at step 0, declines to around 0.45 by step 10, and then fluctuates between approximately 0.4 and 0.5, with some peaks reaching around 0.55. It ends at approximately 0.48 at step 52.
* **Magistral-Small (Brown):** Starts at approximately 0.65 at step 0, decreases to around 0.45 by step 10, and then gradually increases to approximately 0.55 by step 52, showing a slight upward trend in the later steps.
### Key Observations
* All models exhibit a significant drop in similarity during the initial reasoning steps (0-10).
* Claude-3.7-Sonnet maintains the highest similarity scores throughout the reasoning process, remaining consistently above 0.58.
* GPT-OSS-20B consistently shows the lowest similarity scores, generally staying below 0.5.
* Qwen-8B and DS-R1-Qwen-7B show the most volatile behavior, with significant fluctuations in similarity scores.
* Magistral-Small shows a slight increasing trend in similarity towards the end of the reasoning process.
### Interpretation
The chart suggests that the initial reasoning steps are the most divergent for all models, indicating a rapid shift away from the target concept. Claude-3.7-Sonnet demonstrates the most consistent alignment with the target throughout the reasoning process, suggesting a more stable and focused reasoning approach. GPT-OSS-20B, conversely, appears to drift away from the target more quickly and remains less aligned. The fluctuations observed in Qwen-8B and DS-R1-Qwen-7B could indicate a more exploratory or iterative reasoning process, where the model revisits and refines its understanding of the target. The slight increase in similarity for Magistral-Small towards the end suggests a potential convergence or refinement of its reasoning as it progresses.
The metric "Similarity(*C<sub>T</sub>*, *t<sub>i</sub>*)" likely represents a measure of how closely the model's internal representation at reasoning step *t<sub>i</sub>* aligns with the target concept *C<sub>T</sub>*. A higher similarity score indicates a stronger alignment, while a lower score suggests a greater divergence. This data could be used to evaluate the effectiveness and stability of different language models in performing reasoning tasks.