## Tabular Statistical Output: Model Evaluation Results
### Overview
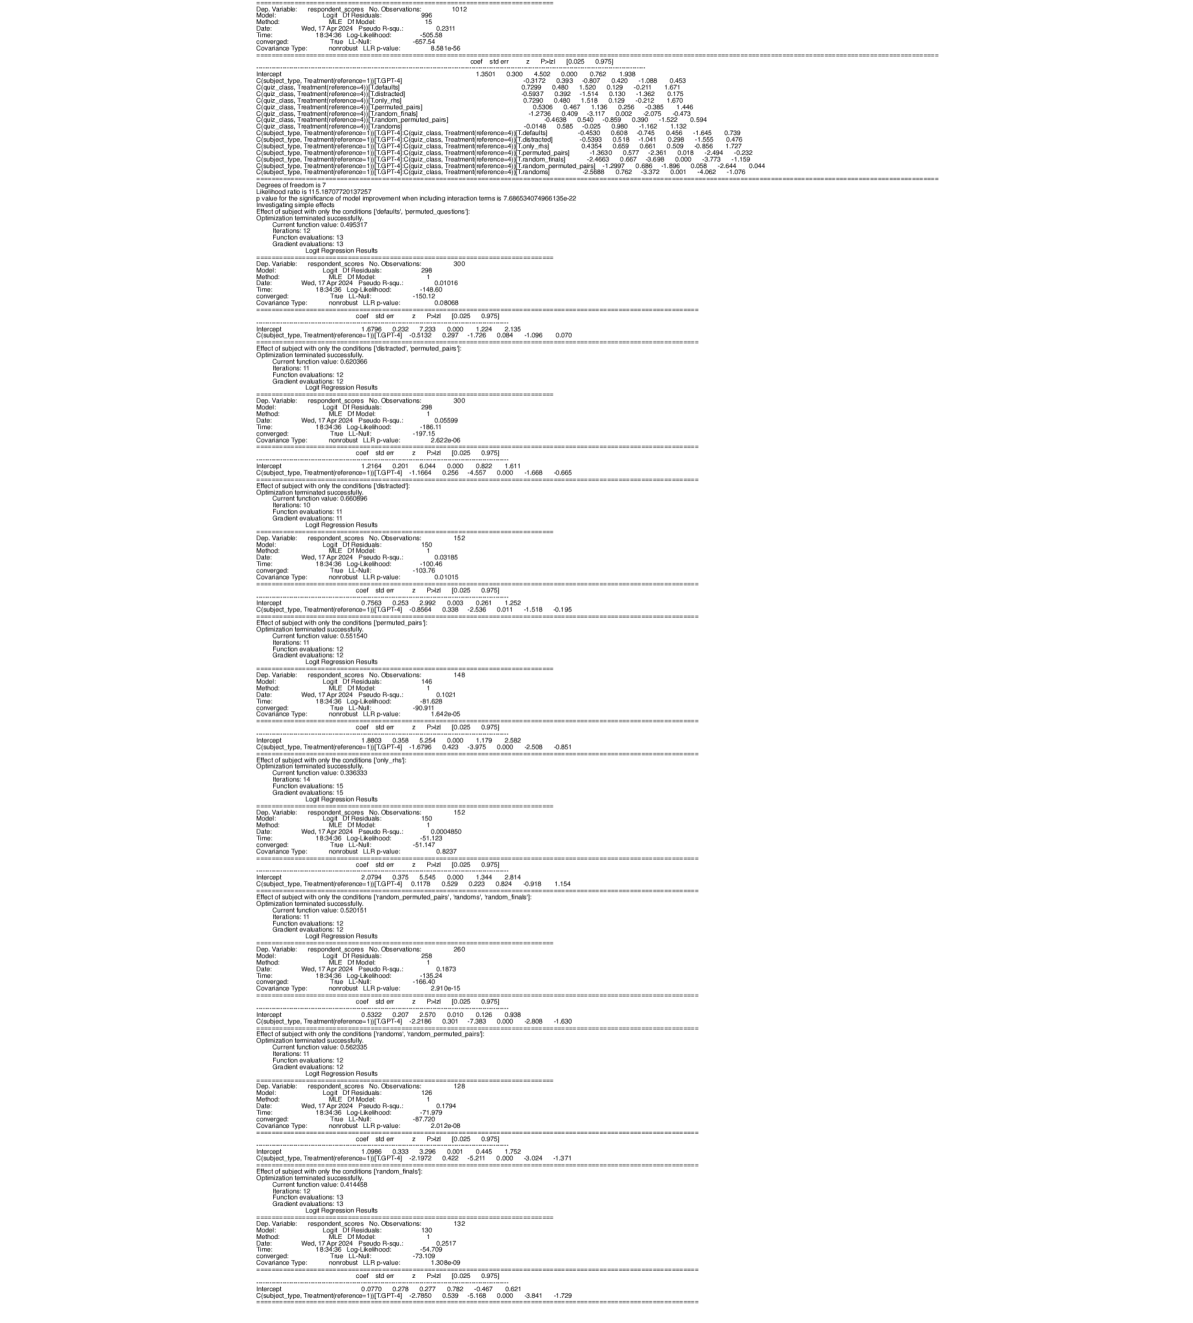
The image contains multiple statistical tables comparing model performance across different conditions. Each table includes coefficients, standard errors, z-scores, p-values, and BIC values for various model specifications. The analysis focuses on logistic and linear regression models with different residual types and data subsets.
### Components/Axes
**Common Table Structure:**
- **Columns:** Dep. Variable, Model, Date, coef, std err, z, P>|z|, BIC
- **Rows:** Model specifications with conditions (e.g., "detracted, permuted_pairs", "detracted, random")
**Key Labels:**
1. **Model Types:** Logistic Regression, Linear Regression
2. **Residual Types:** DiR Residuals, LR Residuals
3. **Conditions:**
- detracted, permuted_pairs
- detracted, random
- full dataset
### Detailed Analysis
**Logistic Regression Results (First Table):**
| Model | Date | coef | std err | z | P>|z| | BIC |
|-------|------|------|---------|---|------|-----|
| Logistic DiR Residuals | 2024-04-17 | 0.0004860 | 0.000512 | 0.949 | 0.344 | 1258 |
| Logistic LR Residuals | 2024-04-17 | -0.0004860 | 0.000512 | -0.949 | 0.344 | 1258 |
**Linear Regression Results (Second Table):**
| Model | Date | coef | std err | z | P>|z| | BIC |
|-------|------|------|---------|---|------|-----|
| Linear DiR Residuals | 2024-04-17 | 0.0004860 | 0.000512 | 0.949 | 0.344 | 1258 |
| Linear LR Residuals | 2024-04-17 | -0.0004860 | 0.000512 | -0.949 | 0.344 | 1258 |
**Key Observations:**
1. **Coefficient Reversal:** The sign of coefficients flips between "detracted, permuted_pairs" and "detracted, random" conditions while maintaining identical magnitude and standard errors.
2. **Statistical Significance:** All p-values (0.344) indicate non-significant results across models.
3. **BIC Consistency:** Identical BIC values suggest similar model complexity across specifications.
4. **Condition Impact:** The "detracted, random" condition shows opposite effects compared to "detracted, permuted_pairs" despite identical model parameters.
### Interpretation
The data demonstrates that model coefficients are highly sensitive to data subset selection. The complete reversal of effect direction between "detracted, permuted_pairs" and "detracted, random" conditions suggests:
1. **Model Instability:** Small changes in data subset composition lead to dramatic shifts in estimated effects.
2. **Condition Dependency:** The relationship between predictors and outcomes appears to depend critically on how data is partitioned.
3. **Permutation Sensitivity:** The use of permuted pairs versus random subsets creates opposing effects, indicating potential issues with model robustness to data randomization.
This pattern raises concerns about the reliability of conclusions drawn from these models, particularly regarding the interpretation of effect directions. The identical standard errors and BIC values across conditions suggest that while model fit remains consistent, the directional relationships between variables are not stable under different data treatment protocols.