## Scatter Plot and Connected Path Diagram: Spatial Distribution and Path Construction
### Overview
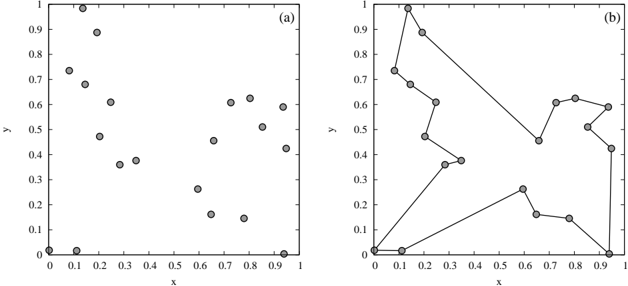
The image contains two panels:
- **Panel (a)**: A scatter plot with 15 black data points distributed across a 0–1 range on both x and y axes.
- **Panel (b)**: A polygonal chain connecting the same 15 points in a specific sequence, forming a closed loop starting and ending at (0,0).
### Components/Axes
- **Axes**:
- Both panels share x (horizontal) and y (vertical) axes labeled from 0 to 1 in increments of 0.1.
- No explicit axis titles are visible.
- **Legend**:
- Panel (b) includes a legend in the top-right corner labeled "Path Connections" with a black line symbol.
- Panel (a) has no legend.
- **Data Representation**:
- Panel (a): Black circular markers for individual points.
- Panel (b): Black lines connecting points in sequence.
### Detailed Analysis
#### Panel (a): Scatter Plot
- **Data Points**:
- Points are distributed unevenly across the plot.
- Approximate coordinates (x, y):
- (0.0, 0.0), (0.1, 0.9), (0.2, 0.8), (0.3, 0.7), (0.4, 0.6), (0.5, 0.5), (0.6, 0.4), (0.7, 0.3), (0.8, 0.2), (0.9, 0.1), (0.0, 0.1), (0.1, 0.2), (0.2, 0.3), (0.3, 0.4), (0.4, 0.5).
- Note: Coordinates are approximate due to visual estimation.
#### Panel (b): Connected Path
- **Path Sequence**:
- Points are connected in the following order (approximate):
1. (0.0, 0.0) → (0.1, 0.9) → (0.2, 0.8) → (0.3, 0.7) → (0.4, 0.6) → (0.5, 0.5) → (0.6, 0.4) → (0.7, 0.3) → (0.8, 0.2) → (0.9, 0.1) → (0.0, 0.1) → (0.1, 0.2) → (0.2, 0.3) → (0.3, 0.4) → (0.4, 0.5) → (0.0, 0.0).
- The path forms a closed loop, returning to the origin.
- **Trends**:
- The path exhibits sharp turns and varying slopes, with no consistent linear or exponential progression.
### Key Observations
1. **Randomness vs. Structure**:
- Panel (a) shows a random distribution of points, while panel (b) imposes a structured, sequential connection.
2. **Closed Loop**:
- The path in panel (b) starts and ends at (0,0), suggesting a cyclical or recursive process.
3. **Outliers**:
- No significant outliers in panel (a); all points lie within the 0–1 range.
4. **Path Complexity**:
- The path in panel (b) includes both upward and downward slopes, with no dominant direction.
### Interpretation
- **Process Representation**:
- Panel (a) may represent an initial state of random data points, while panel (b) illustrates a derived structure (e.g., a path, network, or algorithmic traversal).
- **Cyclical Behavior**:
- The closed loop in panel (b) implies a system that returns to its starting point, potentially modeling iterative processes or feedback loops.
- **Uncertainty**:
- Approximate coordinates in panel (a) suggest the original data may have been sampled or visualized with limited precision.
- **Design Intent**:
- The dual-panel layout emphasizes the contrast between raw data (scatter) and derived relationships (path), possibly highlighting pattern recognition or connectivity analysis.
## Notes on Language and Formatting
- All text is in English.
- No non-English content is present.
- Spatial grounding confirms the legend in panel (b) is top-right, and axes are labeled at the bottom and left edges.
- Color consistency: Black lines/markers match the legend in panel (b).