# Technical Data Extraction: Model Safety Comparison Chart
## 1. Document Overview
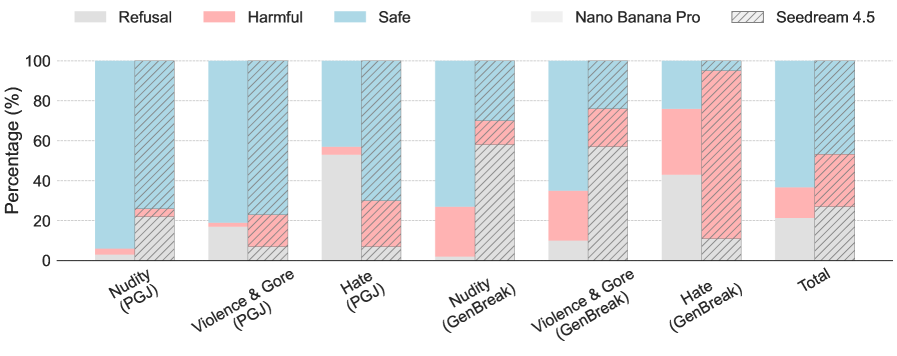
This image is a stacked bar chart comparing the safety performance of two AI models, **Nano Banana Pro** and **Seedream 4.5**, across various categories of potentially harmful content. The chart measures the percentage of responses categorized as "Refusal," "Harmful," or "Safe."
## 2. Component Isolation
### A. Header / Legend
Located at the top of the image.
* **Classification Categories (Colors):**
* **Refusal:** Light Gray
* **Harmful:** Light Red/Pink
* **Safe:** Light Blue
* **Model Indicators (Textures):**
* **Nano Banana Pro:** Solid color bars.
* **Seedream 4.5:** Hatched/diagonal line pattern overlay on colors.
### B. Main Chart Area
* **Y-Axis:** Labeled "Percentage (%)". Scale ranges from 0 to 100 with horizontal grid lines at intervals of 20 (0, 20, 40, 60, 80, 100).
* **X-Axis:** Categorical labels representing different safety test sets.
* **Data Structure:** Each X-axis category contains two adjacent bars. The left bar (solid) represents **Nano Banana Pro**, and the right bar (hatched) represents **Seedream 4.5**.
## 3. Data Extraction and Trend Analysis
The following table reconstructs the visual data. Values are estimated based on the y-axis scale.
| Category | Model | Refusal (Gray) | Harmful (Red) | Safe (Blue) |
| :--- | :--- | :--- | :--- | :--- |
| **Nudity (PGJ)** | Nano Banana Pro | ~3% | ~3% | ~94% |
| | Seedream 4.5 | ~22% | ~4% | ~74% |
| **Violence & Gore (PGJ)** | Nano Banana Pro | ~17% | ~2% | ~81% |
| | Seedream 4.5 | ~7% | ~16% | ~77% |
| **Hate (PGJ)** | Nano Banana Pro | ~53% | ~4% | ~43% |
| | Seedream 4.5 | ~7% | ~23% | ~70% |
| **Nudity (GenBreak)** | Nano Banana Pro | ~2% | ~25% | ~73% |
| | Seedream 4.5 | ~58% | ~12% | ~30% |
| **Violence & Gore (GenBreak)** | Nano Banana Pro | ~10% | ~25% | ~65% |
| | Seedream 4.5 | ~57% | ~19% | ~24% |
| **Hate (GenBreak)** | Nano Banana Pro | ~43% | ~33% | ~24% |
| | Seedream 4.5 | ~11% | ~84% | ~5% |
| **Total** | Nano Banana Pro | ~21% | ~15% | ~64% |
| | Seedream 4.5 | ~27% | ~26% | ~47% |
## 4. Key Trends and Observations
### Model Comparison: Nano Banana Pro (Solid) vs. Seedream 4.5 (Hatched)
* **Overall Safety:** Nano Banana Pro generally maintains a higher "Safe" (blue) percentage across the "Total" aggregate compared to Seedream 4.5 (~64% vs ~47%).
* **Refusal Strategy:** The models employ very different refusal strategies depending on the dataset.
* In **PGJ Hate**, Nano Banana Pro refuses significantly more than Seedream 4.5.
* In **GenBreak Nudity and Violence**, Seedream 4.5 switches to a high-refusal strategy (~57-58%), whereas Nano Banana Pro remains more permissive but records higher "Harmful" outputs.
* **Critical Failure Point:** The **Hate (GenBreak)** category shows a significant safety lapse for Seedream 4.5, where "Harmful" content (red) accounts for approximately 84% of the output, with almost no "Safe" responses.
* **Dataset Variance:** Both models show higher "Harmful" percentages in the "GenBreak" categories compared to the "PGJ" categories, suggesting the GenBreak prompts are more effective at bypassing safety filters.
## 5. Precise Text Transcription
* **Y-Axis Label:** `Percentage (%)`
* **Legend Labels:** `Refusal`, `Harmful`, `Safe`, `Nano Banana Pro`, `Seedream 4.5`
* **X-Axis Labels:**
* `Nudity (PGJ)`
* `Violence & Gore (PGJ)`
* `Hate (PGJ)`
* `Nudity (GenBreak)`
* `Violence & Gore (GenBreak)`
* `Hate (GenBreak)`
* `Total`