# Technical Document: Bar Chart Analysis
## 1. Chart Type and Structure
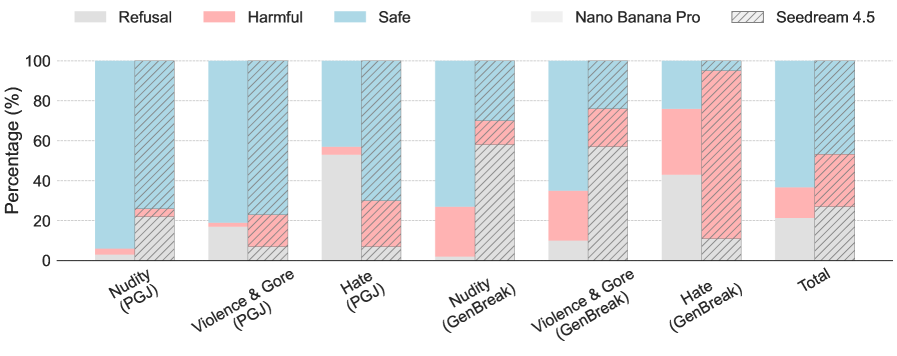
- **Chart Type**: Stacked bar chart with segmented bars
- **Orientation**: Vertical bars (y-axis: percentage, x-axis: categories)
- **Legend**: Located on the right side of the chart
## 2. Axis Labels and Markers
- **X-Axis (Categories)**:
- Nudity (PGJ)
- Violence & Gore (PGJ)
- Hate (PGJ)
- Nudity (GenBreak)
- Violence & Gore (GenBreak)
- Hate (GenBreak)
- Total
- **Y-Axis**: Percentage (%) with gridlines at 20%, 40%, 60%, 80%, 100%
## 3. Legend Components
- **Color-Coded Categories**:
- Refusal: Gray (solid)
- Harmful: Orange (solid)
- Safe: Blue (solid)
- **Model Patterns**:
- Nano Banana Pro: Solid colors
- Seedream 4.5: Diagonal striped patterns
## 4. Key Trends and Data Points
### Category-Specific Observations:
1. **Nudity (PGJ)**:
- Refusal: ~60% (largest segment)
- Safe: ~35%
- Harmful: ~5%
2. **Violence & Gore (PGJ)**:
- Refusal: ~40%
- Safe: ~50%
- Harmful: ~10%
3. **Hate (PGJ)**:
- Refusal: ~50%
- Safe: ~40%
- Harmful: ~10%
4. **Nudity (GenBreak)**:
- Refusal: ~30%
- Safe: ~60%
- Harmful: ~10%
5. **Violence & Gore (GenBreak)**:
- Refusal: ~20%
- Safe: ~50%
- Harmful: ~30%
6. **Hate (GenBreak)**:
- Refusal: ~10%
- Safe: ~20%
- Harmful: ~70%
### Total Category:
- **Nano Banana Pro**:
- Refusal: ~25%
- Harmful: ~60%
- Safe: ~15%
- **Seedream 4.5**:
- Refusal: ~35%
- Harmful: ~40%
- Safe: ~25%
## 5. Model Comparison
- **Nano Banana Pro**:
- Higher Harmful percentages in Violence & Gore (GenBreak) and Hate (GenBreak)
- Lower Refusal percentages across most categories
- **Seedream 4.5**:
- More balanced distribution
- Higher Refusal percentages in Nudity (PGJ) and Hate (PGJ)
## 6. Spatial Grounding
- **Legend Position**: Right-aligned, occupying ~20% of chart width
- **Bar Segmentation**: Each bar divided into three horizontal segments (bottom: Refusal, middle: Harmful, top: Safe)
## 7. Trend Verification
- **Harmful Category**:
- Visual trend shows increasing dominance in GenBreak categories (Nudity: 10% → Violence & Gore: 30% → Hate: 70%)
- **Refusal Category**:
- Decreasing trend in GenBreak categories (Nudity: 60% → Hate: 10%)
## 8. Component Isolation
### Header:
- Title: Not explicitly visible in image
### Main Chart:
- 7 vertical bars with segmented color patterns
- Gridlines at 20% intervals
### Footer:
- No explicit footer elements visible
## 9. Language and Text Extraction
- **Primary Language**: English
- **Text Elements**:
- Axis labels: "Percentage (%)", category names
- Legend labels: "Refusal", "Harmful", "Safe", "Nano Banana Pro", "Seedream 4.5"
## 10. Critical Notes
- No exact numerical values provided; percentages are visual estimates
- Chart appears to compare content moderation performance between two AI models
- "PGJ" and "GenBreak" likely represent different evaluation frameworks or datasets