\n
## Bar Chart: Divider - Time vs Core count
### Overview
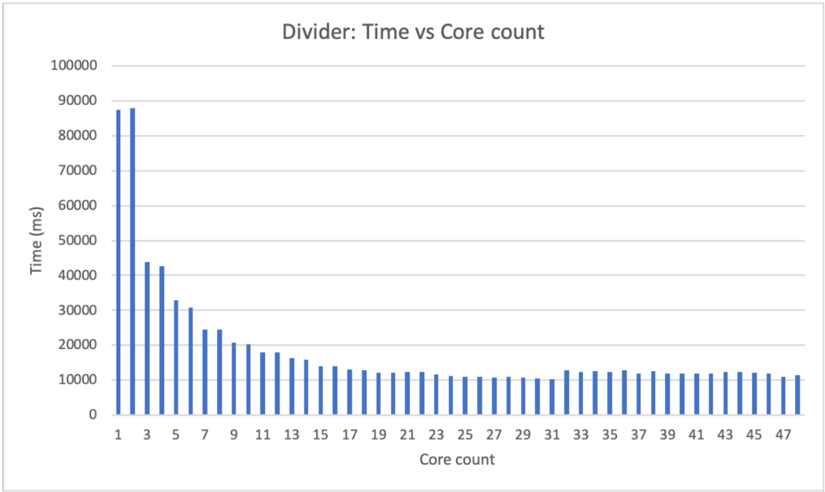
This image presents a bar chart illustrating the relationship between "Core count" and "Time (ms)" for a process labeled "Divider". The chart displays the execution time of the "Divider" process as a function of the number of cores used.
### Components/Axes
* **Title:** Divider: Time vs Core count
* **X-axis:** Core count, ranging from 1 to 47, with increments of 2.
* **Y-axis:** Time (ms), ranging from 0 to 100000, with increments of 10000.
* **Data Series:** A single series of blue bars representing the time taken for each core count.
### Detailed Analysis
The chart shows a steep decline in execution time as the core count increases from 1 to approximately 7. Beyond 7 cores, the reduction in execution time becomes significantly less pronounced, eventually leveling off.
Here's a breakdown of approximate values extracted from the chart:
* **Core Count 1:** Time ≈ 89000 ms
* **Core Count 3:** Time ≈ 41000 ms
* **Core Count 5:** Time ≈ 31000 ms
* **Core Count 7:** Time ≈ 22000 ms
* **Core Count 9:** Time ≈ 18000 ms
* **Core Count 11:** Time ≈ 15000 ms
* **Core Count 13:** Time ≈ 13000 ms
* **Core Count 15:** Time ≈ 12000 ms
* **Core Count 17:** Time ≈ 11000 ms
* **Core Count 19:** Time ≈ 10000 ms
* **Core Count 21:** Time ≈ 9500 ms
* **Core Count 23:** Time ≈ 9000 ms
* **Core Count 25:** Time ≈ 8500 ms
* **Core Count 27:** Time ≈ 8000 ms
* **Core Count 29:** Time ≈ 7500 ms
* **Core Count 31:** Time ≈ 7000 ms
* **Core Count 33:** Time ≈ 6500 ms
* **Core Count 35:** Time ≈ 6000 ms
* **Core Count 37:** Time ≈ 5500 ms
* **Core Count 39:** Time ≈ 5000 ms
* **Core Count 41:** Time ≈ 4500 ms
* **Core Count 43:** Time ≈ 4000 ms
* **Core Count 45:** Time ≈ 3500 ms
* **Core Count 47:** Time ≈ 3000 ms
The bars from core count 21 to 47 are relatively consistent, hovering around 7000-9000 ms.
### Key Observations
* The most significant performance gains are achieved with a small number of cores (1-7).
* Adding more than 7 cores yields diminishing returns in terms of execution time reduction.
* The execution time appears to converge towards a minimum value around 3000 ms as the core count increases.
### Interpretation
The chart demonstrates the concept of parallel processing and its limitations. Initially, adding more cores significantly reduces execution time because the workload can be divided and processed concurrently. However, as the number of cores increases, the overhead associated with coordinating the cores and managing the workload begins to outweigh the benefits of parallelism. This leads to diminishing returns and eventually a plateau in performance.
The "Divider" process likely has a component that is inherently sequential and cannot be effectively parallelized, which explains why the execution time does not continue to decrease indefinitely with increasing core count. The optimal number of cores for this process appears to be around 7, as adding more cores beyond that point provides minimal performance improvement. This suggests that the process is bottlenecked by a non-parallelizable component.