## Bar Chart: Divider: Time vs Core count
### Overview
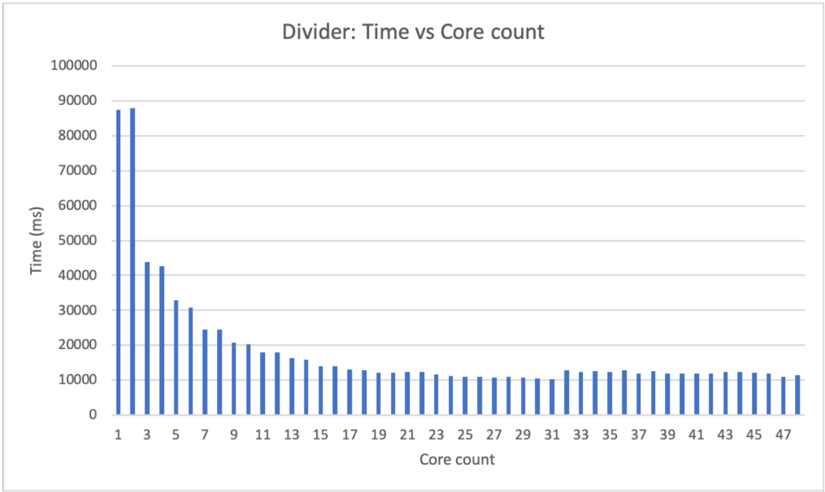
The bar chart displays the relationship between the time taken by a divider and the core count. The x-axis represents the core count, ranging from 1 to 47, while the y-axis represents the time in milliseconds, ranging from 0 to 100,000 ms.
### Components/Axes
- **Title**: Divider: Time vs Core count
- **X-axis**: Core count (ranging from 1 to 47)
- **Y-axis**: Time (milliseconds, ranging from 0 to 100,000 ms)
- **Legend**: No legend is present in the image.
### Detailed Analysis or ### Content Details
The chart shows a clear inverse relationship between the core count and the time taken by the divider. As the core count increases, the time taken decreases. The highest time taken is observed at a core count of 1, with a time of approximately 85,000 ms. The time taken decreases as the core count increases, reaching its lowest point at a core count of 47, with a time of approximately 10,000 ms.
### Key Observations
- The highest time taken is at a core count of 1.
- The time taken decreases as the core count increases.
- The lowest time taken is at a core count of 47.
### Interpretation
The data suggests that as the number of cores increases, the time taken by the divider decreases. This could be due to the parallel processing capabilities of multi-core systems, where multiple tasks can be executed simultaneously, reducing the overall time taken. However, it is important to note that the relationship is not linear, as the time taken decreases more rapidly at lower core counts and then levels off at higher core counts. This could be due to the overhead of managing multiple cores and the diminishing returns of additional cores.