## Bar Chart: Divider: Time vs Core count
### Overview
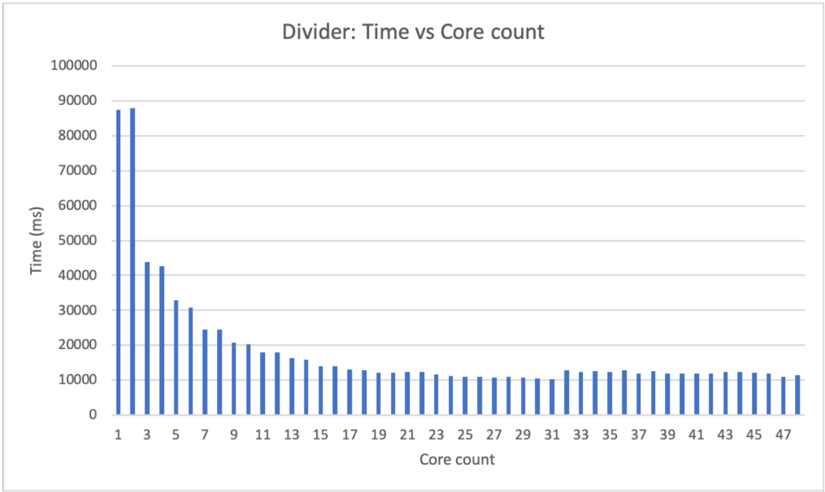
The chart visualizes the relationship between core count (x-axis) and processing time in milliseconds (y-axis). It shows a bar graph with 24 vertical blue bars representing time measurements across core counts from 1 to 47. The y-axis scales logarithmically from 0 to 100,000 ms, while the x-axis increments by 2 cores. The title emphasizes a "Divider" relationship between time and core count.
### Components/Axes
- **X-axis (Core count)**: Labeled "Core count" with values 1, 3, 5, ..., 47 (odd numbers up to 47).
- **Y-axis (Time)**: Labeled "Time (ms)" with logarithmic scale from 0 to 100,000 ms in 10,000 ms increments.
- **Legend**: Single blue bar color with no explicit label, implying a single data series.
- **Title**: "Divider: Time vs Core count" centered at the top.
### Detailed Analysis
- **Core 1**: Tallest bar at ~88,000 ms (highest time).
- **Core 3**: ~45,000 ms (50% reduction from Core 1).
- **Core 5**: ~32,000 ms (28% reduction from Core 3).
- **Core 7**: ~24,000 ms (25% reduction from Core 5).
- **Core 9**: ~20,000 ms (20% reduction from Core 7).
- **Core 11**: ~18,000 ms (10% reduction from Core 9).
- **Cores 13–47**: Bars plateau between ~10,000–12,000 ms, showing minimal variation.
### Key Observations
1. **Steep Initial Decline**: Time drops rapidly from Core 1 to Core 11 (~88,000 ms → ~18,000 ms).
2. **Plateau Effect**: Beyond Core 11, time remains stable (~10,000–12,000 ms) despite doubling core counts.
3. **Diminishing Returns**: Adding cores beyond 11 yields negligible time improvements.
4. **Anomaly**: Core 1’s time (~88,000 ms) is 5.5× higher than Core 3 (~45,000 ms), suggesting non-linear scaling.
### Interpretation
The data demonstrates **Amdahl’s Law** in action: parallel processing gains are limited by sequential tasks. The sharp decline up to Core 11 indicates effective parallelization, while the plateau suggests:
- **Bottlenecks**: A single-threaded component limiting further optimization.
- **Overhead**: Synchronization or communication costs negating benefits of additional cores.
- **Hardware Limits**: Physical constraints (e.g., memory bandwidth) capping scalability.
The "Divider" title metaphorically represents the threshold (Core 11) where time "divides" into a stable range. This pattern is critical for optimizing parallel workloads, as adding cores beyond 11 offers no practical benefit in this scenario.