## Line Chart: Validation Loss vs. Visual Encoder Size for Different LLM Sizes
### Overview
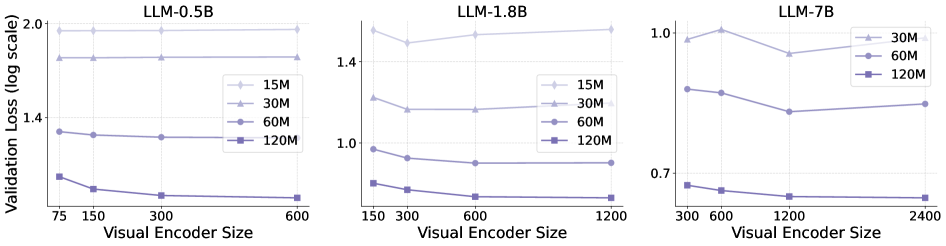
This image presents three line charts, each depicting the relationship between Validation Loss (on a log scale) and Visual Encoder Size. Each chart corresponds to a different Large Language Model (LLM) size: 0.5B, 1.8B, and 7B. Within each chart, multiple lines represent different numbers of training samples (15M, 30M, 60M, and 120M). The charts aim to illustrate how validation loss changes with increasing visual encoder size for various LLM and training data configurations.
### Components/Axes
* **X-axis (all charts):** Visual Encoder Size. Scales vary per chart:
* LLM-0.5B: 75, 150, 300, 600
* LLM-1.8B: 150, 300, 600, 1200
* LLM-7B: 300, 600, 1200, 2400
* **Y-axis (all charts):** Validation Loss (log scale). Scales vary per chart:
* LLM-0.5B: 1.3 to 2.0
* LLM-1.8B: 0.7 to 1.4
* LLM-7B: 0.6 to 1.1
* **Legends (all charts):**
* 15M (Light Blue)
* 30M (Gray)
* 60M (Dark Gray)
* 120M (Black)
* **Titles (each chart):** LLM-0.5B, LLM-1.8B, LLM-7B. Positioned at the top-center of each chart.
### Detailed Analysis
**LLM-0.5B (Left Chart):**
* The 15M line starts at approximately 1.85 and decreases to around 1.65.
* The 30M line starts at approximately 1.75 and decreases to around 1.55.
* The 60M line is relatively flat, starting at approximately 1.45 and remaining around 1.4.
* The 120M line is also relatively flat, starting at approximately 1.4 and remaining around 1.4.
* Overall trend: Validation loss generally decreases with increasing visual encoder size, especially for the 15M and 30M training data sizes.
**LLM-1.8B (Middle Chart):**
* The 15M line starts at approximately 1.35 and decreases sharply to around 0.8.
* The 30M line starts at approximately 1.2 and decreases to around 0.9.
* The 60M line starts at approximately 1.0 and decreases to around 0.8.
* The 120M line starts at approximately 0.9 and decreases to around 0.7.
* Overall trend: Validation loss decreases significantly with increasing visual encoder size for all training data sizes. The decrease appears more pronounced for the 15M training data.
**LLM-7B (Right Chart):**
* The 30M line starts at approximately 1.05 and decreases to around 0.9.
* The 60M line starts at approximately 0.95 and decreases to around 0.8.
* The 120M line starts at approximately 0.85 and decreases to around 0.7.
* Overall trend: Validation loss decreases with increasing visual encoder size, but the decrease is less dramatic than in the 1.8B chart. The lines are relatively close together.
### Key Observations
* Larger LLMs (1.8B and 7B) generally exhibit lower validation loss compared to the smaller LLM (0.5B).
* Increasing the visual encoder size generally leads to a decrease in validation loss, suggesting improved performance with larger encoders.
* The impact of visual encoder size on validation loss appears to be more significant for smaller LLMs and smaller training datasets.
* The 120M training data size consistently results in the lowest validation loss across all LLM sizes.
* The 0.5B model shows less sensitivity to the visual encoder size compared to the 1.8B and 7B models.
### Interpretation
The data suggests that increasing the size of the visual encoder and the amount of training data generally improves the performance of the LLM, as measured by validation loss. The effect is most pronounced for smaller LLMs and smaller training datasets. This indicates that larger models and more data benefit more from larger visual encoders. The flattening of the curves for the 0.5B model with larger encoder sizes suggests a point of diminishing returns, where further increasing the encoder size does not significantly reduce validation loss. The consistent performance of the 120M training data across all LLM sizes highlights the importance of data quantity in achieving optimal performance. The log scale on the Y-axis emphasizes the relative changes in validation loss, making it easier to compare the performance of different configurations. The charts provide valuable insights into the trade-offs between model size, data quantity, and visual encoder size in the context of LLM training.