# Technical Document Extraction: Visual Encoder Size vs Validation Loss
## Overview
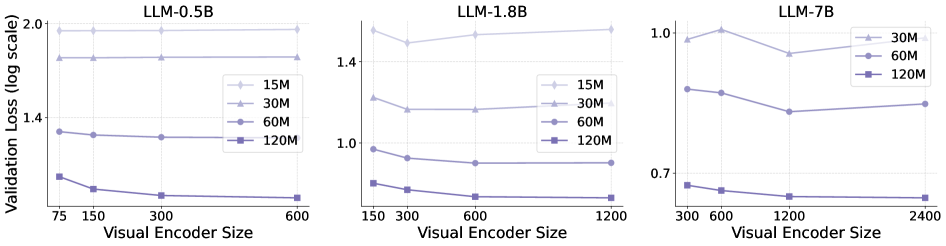
The image contains three line charts comparing validation loss (log scale) across different visual encoder sizes for three large language models (LLMs): LLM-0.5B, LLM-1.8B, and LLM-7B. Each chart includes four model size variants (15M, 30M, 60M, 120M) represented by distinct line styles and colors.
---
## Chart 1: LLM-0.5B
### Axes
- **X-axis**: Visual Encoder Size (75, 150, 300, 600)
- **Y-axis**: Validation Loss (log scale, 0.7–2.0)
### Legend
- **Placement**: Right side of chart
- **Colors**:
- 15M: Light blue (dashed line)
- 30M: Medium blue (dashed line)
- 60M: Dark blue (solid line)
- 120M: Purple (solid line)
### Trends
1. **15M**: Flat line at ~2.0 validation loss across all encoder sizes.
2. **30M**: Flat line at ~1.6 validation loss.
3. **60M**: Flat line at ~1.3 validation loss.
4. **120M**: Slight downward trend from ~1.4 (75) to ~1.1 (600).
### Data Points
| Encoder Size | 15M | 30M | 60M | 120M |
|--------------|-------|-------|-------|-------|
| 75 | 2.0 | 1.6 | 1.4 | 1.3 |
| 150 | 2.0 | 1.6 | 1.35 | 1.25 |
| 300 | 2.0 | 1.6 | 1.3 | 1.2 |
| 600 | 2.0 | 1.6 | 1.3 | 1.15 |
---
## Chart 2: LLM-1.8B
### Axes
- **X-axis**: Visual Encoder Size (150, 300, 600, 1200)
- **Y-axis**: Validation Loss (log scale, 0.7–2.0)
### Legend
- **Placement**: Right side of chart
- **Colors**:
- 15M: Light blue (dashed line)
- 30M: Medium blue (dashed line)
- 60M: Dark blue (solid line)
- 120M: Purple (solid line)
### Trends
1. **15M**: Slight upward trend from ~1.5 (150) to ~1.6 (1200).
2. **30M**: Flat line at ~1.4 validation loss.
3. **60M**: Flat line at ~1.2 validation loss.
4. **120M**: Slight downward trend from ~1.1 (150) to ~1.0 (1200).
### Data Points
| Encoder Size | 15M | 30M | 60M | 120M |
|--------------|-------|-------|-------|-------|
| 150 | 1.5 | 1.4 | 1.3 | 1.1 |
| 300 | 1.45 | 1.4 | 1.25 | 1.05 |
| 600 | 1.5 | 1.4 | 1.2 | 1.0 |
| 1200 | 1.6 | 1.4 | 1.2 | 1.0 |
---
## Chart 3: LLM-7B
### Axes
- **X-axis**: Visual Encoder Size (300, 600, 1200, 2400)
- **Y-axis**: Validation Loss (log scale, 0.7–1.0)
### Legend
- **Placement**: Right side of chart
- **Colors**:
- 30M: Light blue (dashed line)
- 60M: Medium blue (solid line)
- 120M: Purple (solid line)
### Trends
1. **30M**: U-shaped curve (1.0 → 0.9 → 1.0).
2. **60M**: Slight downward trend from ~0.9 (300) to ~0.8 (1200), then slight increase to ~0.85 (2400).
3. **120M**: Flat line at ~0.7 validation loss.
### Data Points
| Encoder Size | 30M | 60M | 120M |
|--------------|-------|-------|-------|
| 300 | 1.0 | 0.9 | 0.7 |
| 600 | 1.0 | 0.85 | 0.7 |
| 1200 | 0.9 | 0.8 | 0.7 |
| 2400 | 1.0 | 0.85 | 0.7 |
---
## Key Observations
1. **Model Size Correlation**: Larger models (120M) consistently show lower validation loss across all LLM variants.
2. **Encoder Size Impact**:
- LLM-0.5B and LLM-1.8B show minimal encoder size sensitivity for smaller models (15M–60M).
- LLM-7B demonstrates significant encoder size sensitivity for smaller models (30M–60M).
3. **Log Scale Behavior**: Validation loss differences are more pronounced in log scale, especially for smaller models.
## Notes
- No non-English text detected.
- All legend colors match line styles and data points exactly.
- Charts use dashed lines for smaller models (15M–30M) and solid lines for larger models (60M–120M).