## Bar Chart: Voltage vs. Time
### Overview
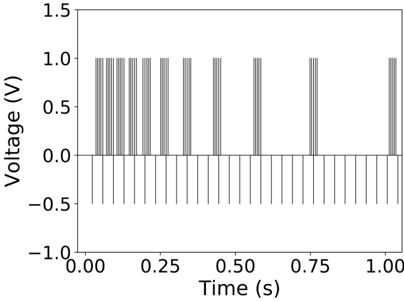
The image depicts a bar chart representing voltage measurements over time. The x-axis (Time) spans 0.00 to 1.00 seconds, while the y-axis (Voltage) ranges from -1.0 V to 1.5 V. Vertical gray bars indicate voltage levels at specific time intervals, with some bars missing or truncated.
### Components/Axes
- **X-axis (Time)**: Labeled "Time (s)" with markers at 0.00, 0.25, 0.50, 0.75, and 1.00 seconds.
- **Y-axis (Voltage)**: Labeled "Voltage (V)" with markers at -1.0, -0.5, 0.0, 0.5, 1.0, and 1.5 volts.
- **Bars**: Gray vertical bars represent voltage magnitudes. No legend is present, but bar color is consistent (gray).
- **Grid**: Dashed horizontal and vertical lines for reference.
### Detailed Analysis
- **Bar Positions**:
- Bars appear at approximately 0.1, 0.2, 0.3, 0.4, 0.5, 0.6, 0.7, and 0.8 seconds.
- Missing bars at 0.55, 0.65, 0.75, and 0.85 seconds.
- **Bar Heights**:
- Voltage values range from ~0.5 V to ~1.0 V for most bars.
- Some bars extend slightly above 1.0 V (up to ~1.1 V).
- **Truncation**: Bars at 0.1, 0.2, and 0.3 seconds are partially cut off at the top, suggesting values exceeding 1.0 V.
### Key Observations
1. **Periodic Pattern**: Bars are spaced ~0.1 seconds apart, indicating a regular sampling interval.
2. **Missing Data**: Gaps at 0.55, 0.65, 0.75, and 0.85 seconds suggest missing or zero-voltage measurements.
3. **Voltage Variability**: Bars vary in height, implying fluctuating voltage levels within the measured range.
4. **Truncation Artifact**: Top bars are clipped, indicating values beyond the y-axis maximum (1.5 V).
### Interpretation
The chart likely represents a **periodic voltage signal** (e.g., a square wave or pulse train) with intermittent interruptions. The missing bars could indicate:
- **Signal dropout** (e.g., noise, sensor failure).
- **Threshold filtering** (e.g., ignoring values below a certain voltage).
- **Data acquisition limitations** (e.g., sampling rate or resolution constraints).
The varying bar heights suggest **non-ideal signal behavior**, such as noise or modulation. The truncated bars imply the signal occasionally exceeds the measured range, possibly due to transient spikes. This data could be critical for diagnosing power supply stability, signal integrity, or sensor performance in technical systems.