## Line Chart: Inference Accuracy Comparison Over Training Epochs
### Overview
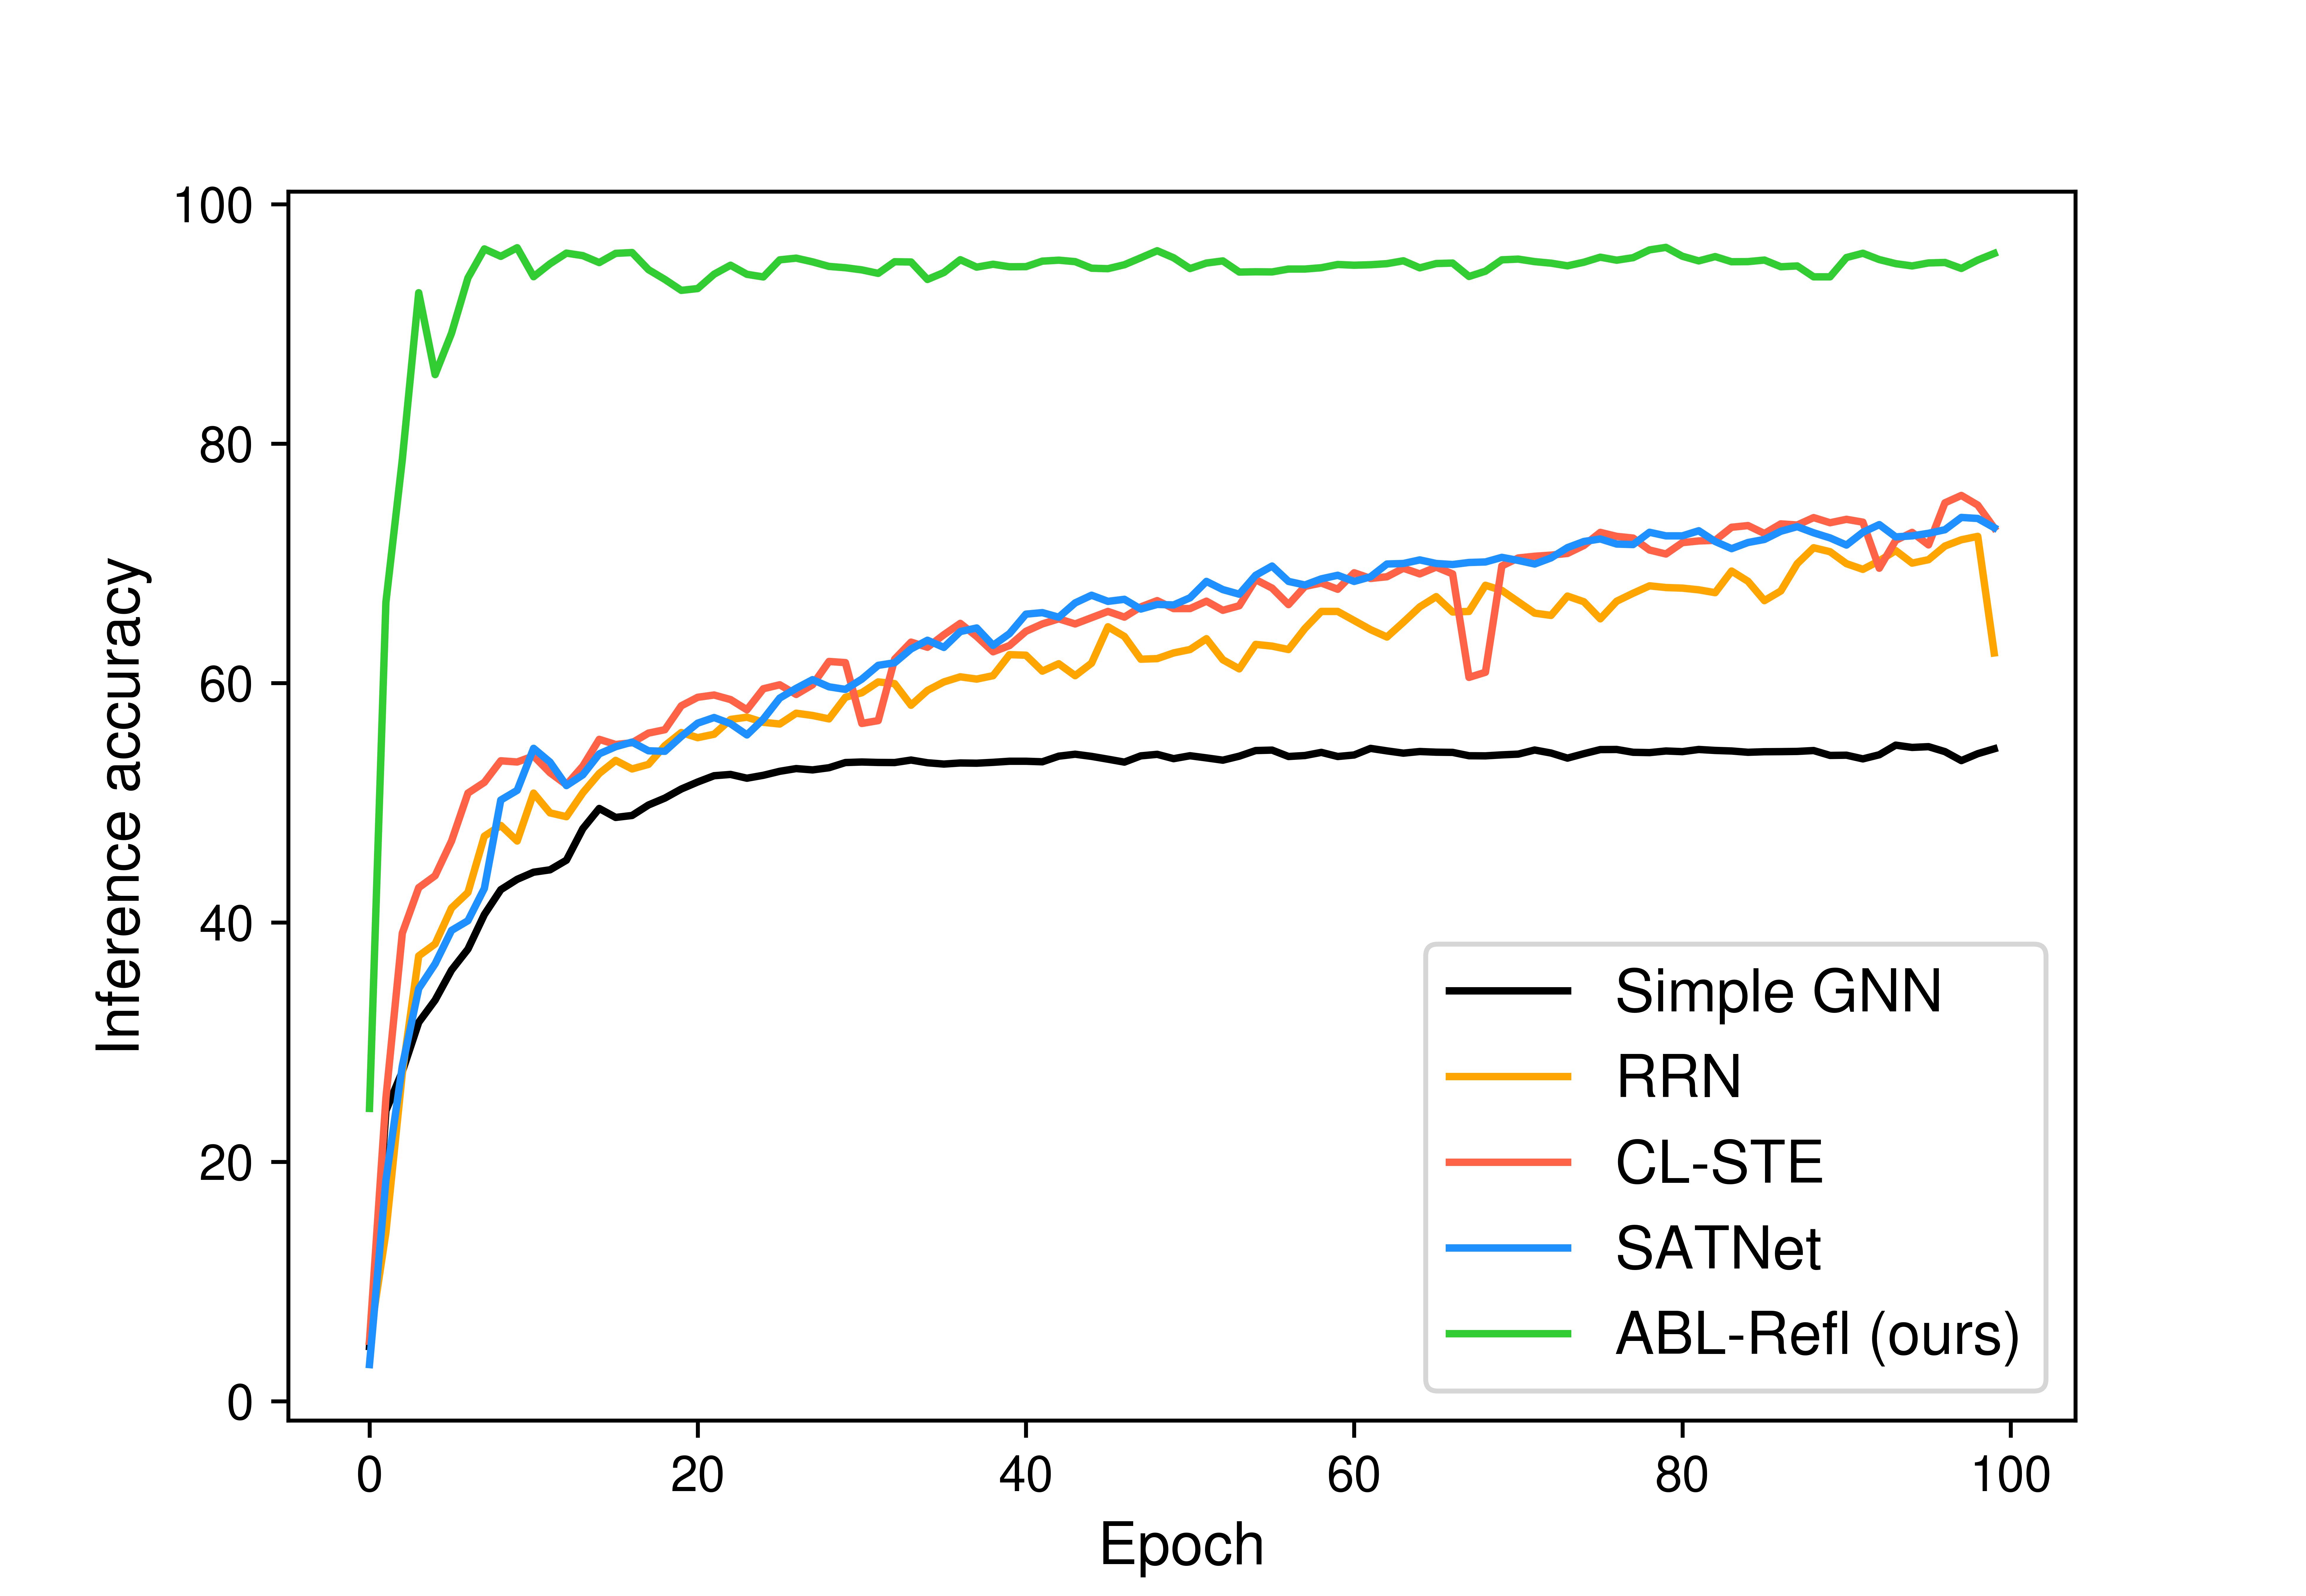
The image is a line chart comparing the inference accuracy of five different machine learning models over the course of 100 training epochs. The chart demonstrates the learning curves and final performance of each model.
### Components/Axes
* **X-Axis (Horizontal):** Labeled "Epoch". It represents the training iterations, with major tick marks at 0, 20, 40, 60, 80, and 100.
* **Y-Axis (Vertical):** Labeled "Inference accuracy". It represents the model's accuracy percentage, with major tick marks at 0, 20, 40, 60, 80, and 100.
* **Legend:** Located in the bottom-right quadrant of the chart area. It maps line colors to model names:
* Black line: `Simple GNN`
* Orange line: `RRN`
* Red line: `CL-STL`
* Blue line: `SATNet`
* Green line: `ABL-Refl (ours)`
### Detailed Analysis
The chart plots five distinct data series, each showing a different trajectory of accuracy improvement over time.
1. **ABL-Refl (ours) - Green Line:**
* **Trend:** Exhibits an extremely rapid initial ascent, reaching near-peak performance within the first ~10 epochs. After this initial spike, it maintains a very high and relatively stable accuracy with minor fluctuations for the remainder of the training.
* **Data Points (Approximate):** Starts near 0% at epoch 0. Surges to approximately 90-95% by epoch 5. From epoch 10 to 100, it fluctuates in a high band, consistently between ~94% and ~97%.
2. **SATNet - Blue Line:**
* **Trend:** Shows a steady, logarithmic-style growth curve. It improves rapidly in the early epochs and then continues to gain accuracy at a decreasing rate, with some volatility.
* **Data Points (Approximate):** Starts near 0%. Reaches ~50% by epoch 10, ~65% by epoch 40, and ~70% by epoch 70. It ends near ~73% at epoch 100.
3. **CL-STL - Red Line:**
* **Trend:** Follows a growth pattern very similar to SATNet (blue), often intertwining with it. It shows a general upward trend with noticeable volatility, including a significant dip.
* **Data Points (Approximate):** Starts near 0%. Tracks closely with the blue line, reaching ~70% by epoch 70. It experiences a sharp drop to approximately 60% around epoch 65 before recovering. It ends near ~74% at epoch 100, slightly above the blue line.
4. **RRN - Orange Line:**
* **Trend:** Also follows a logarithmic growth curve but consistently performs slightly below the blue (SATNet) and red (CL-STL) lines for most of the training. It shows moderate volatility.
* **Data Points (Approximate):** Starts near 0%. Reaches ~45% by epoch 10, ~60% by epoch 40, and ~68% by epoch 80. It ends near ~72% at epoch 100.
5. **Simple GNN - Black Line:**
* **Trend:** Shows the slowest initial growth and plateaus at the lowest final accuracy. Its curve is smoother with less volatility compared to the other non-green lines.
* **Data Points (Approximate):** Starts near 0%. Reaches ~40% by epoch 10, ~52% by epoch 20, and then plateaus. It maintains an accuracy between ~53% and ~55% from epoch 30 to 100.
### Key Observations
* **Performance Hierarchy:** There is a clear and substantial performance gap. The `ABL-Refl (ours)` model (green) dramatically outperforms all other models from the very beginning and maintains a lead of approximately 20-25 percentage points in accuracy throughout.
* **Convergence Speed:** `ABL-Refl` converges to its peak performance almost immediately (within ~5-10 epochs), while the other four models require the full 100 epochs to approach their final, lower accuracy levels.
* **Model Grouping:** The `SATNet` (blue), `CL-STL` (red), and `RRN` (orange) models form a middle-performance cluster with similar learning dynamics, all ending in the low-to-mid 70% range. `Simple GNN` (black) is the lowest-performing model, plateauing in the mid-50% range.
* **Volatility:** The middle cluster (blue, red, orange lines) exhibits more volatility (jagged lines) during training compared to the relatively smooth plateau of the black line and the high, stable performance of the green line. The red line (`CL-STL`) shows the most pronounced single drop in performance.
### Interpretation
This chart is likely from a research paper introducing the `ABL-Refl` model. The data strongly suggests that the proposed `ABL-Refl` method is significantly more effective and efficient for the given inference task than the baseline methods (`Simple GNN`, `RRN`, `CL-STL`, `SATNet`).
* **What the data demonstrates:** The `ABL-Refl` model learns the task with far fewer training iterations (epochs) and achieves a much higher final accuracy. Its stability after the initial learning phase suggests robust generalization.
* **Relationship between elements:** The chart is designed to highlight the superiority of the authors' method. The choice of a bright green color for `ABL-Refl` makes it visually dominant. The clustering of the other four models emphasizes that they represent a class of existing solutions that the new method surpasses.
* **Notable anomalies:** The sharp dip in the `CL-STL` (red) line around epoch 65 is an outlier in its otherwise steady climb, potentially indicating a temporary instability in its training process. The near-identical performance trajectories of `SATNet` and `CL-STL` for much of the chart suggest these models may share similar underlying mechanisms or limitations for this task.
* **Underlying message:** The primary takeaway is not just that `ABL-Refl` is better, but that it represents a qualitative leap in performance—changing the problem from one where accuracy slowly climbs to the 70s to one where near-perfect accuracy (~95%+) is rapidly and reliably achieved.