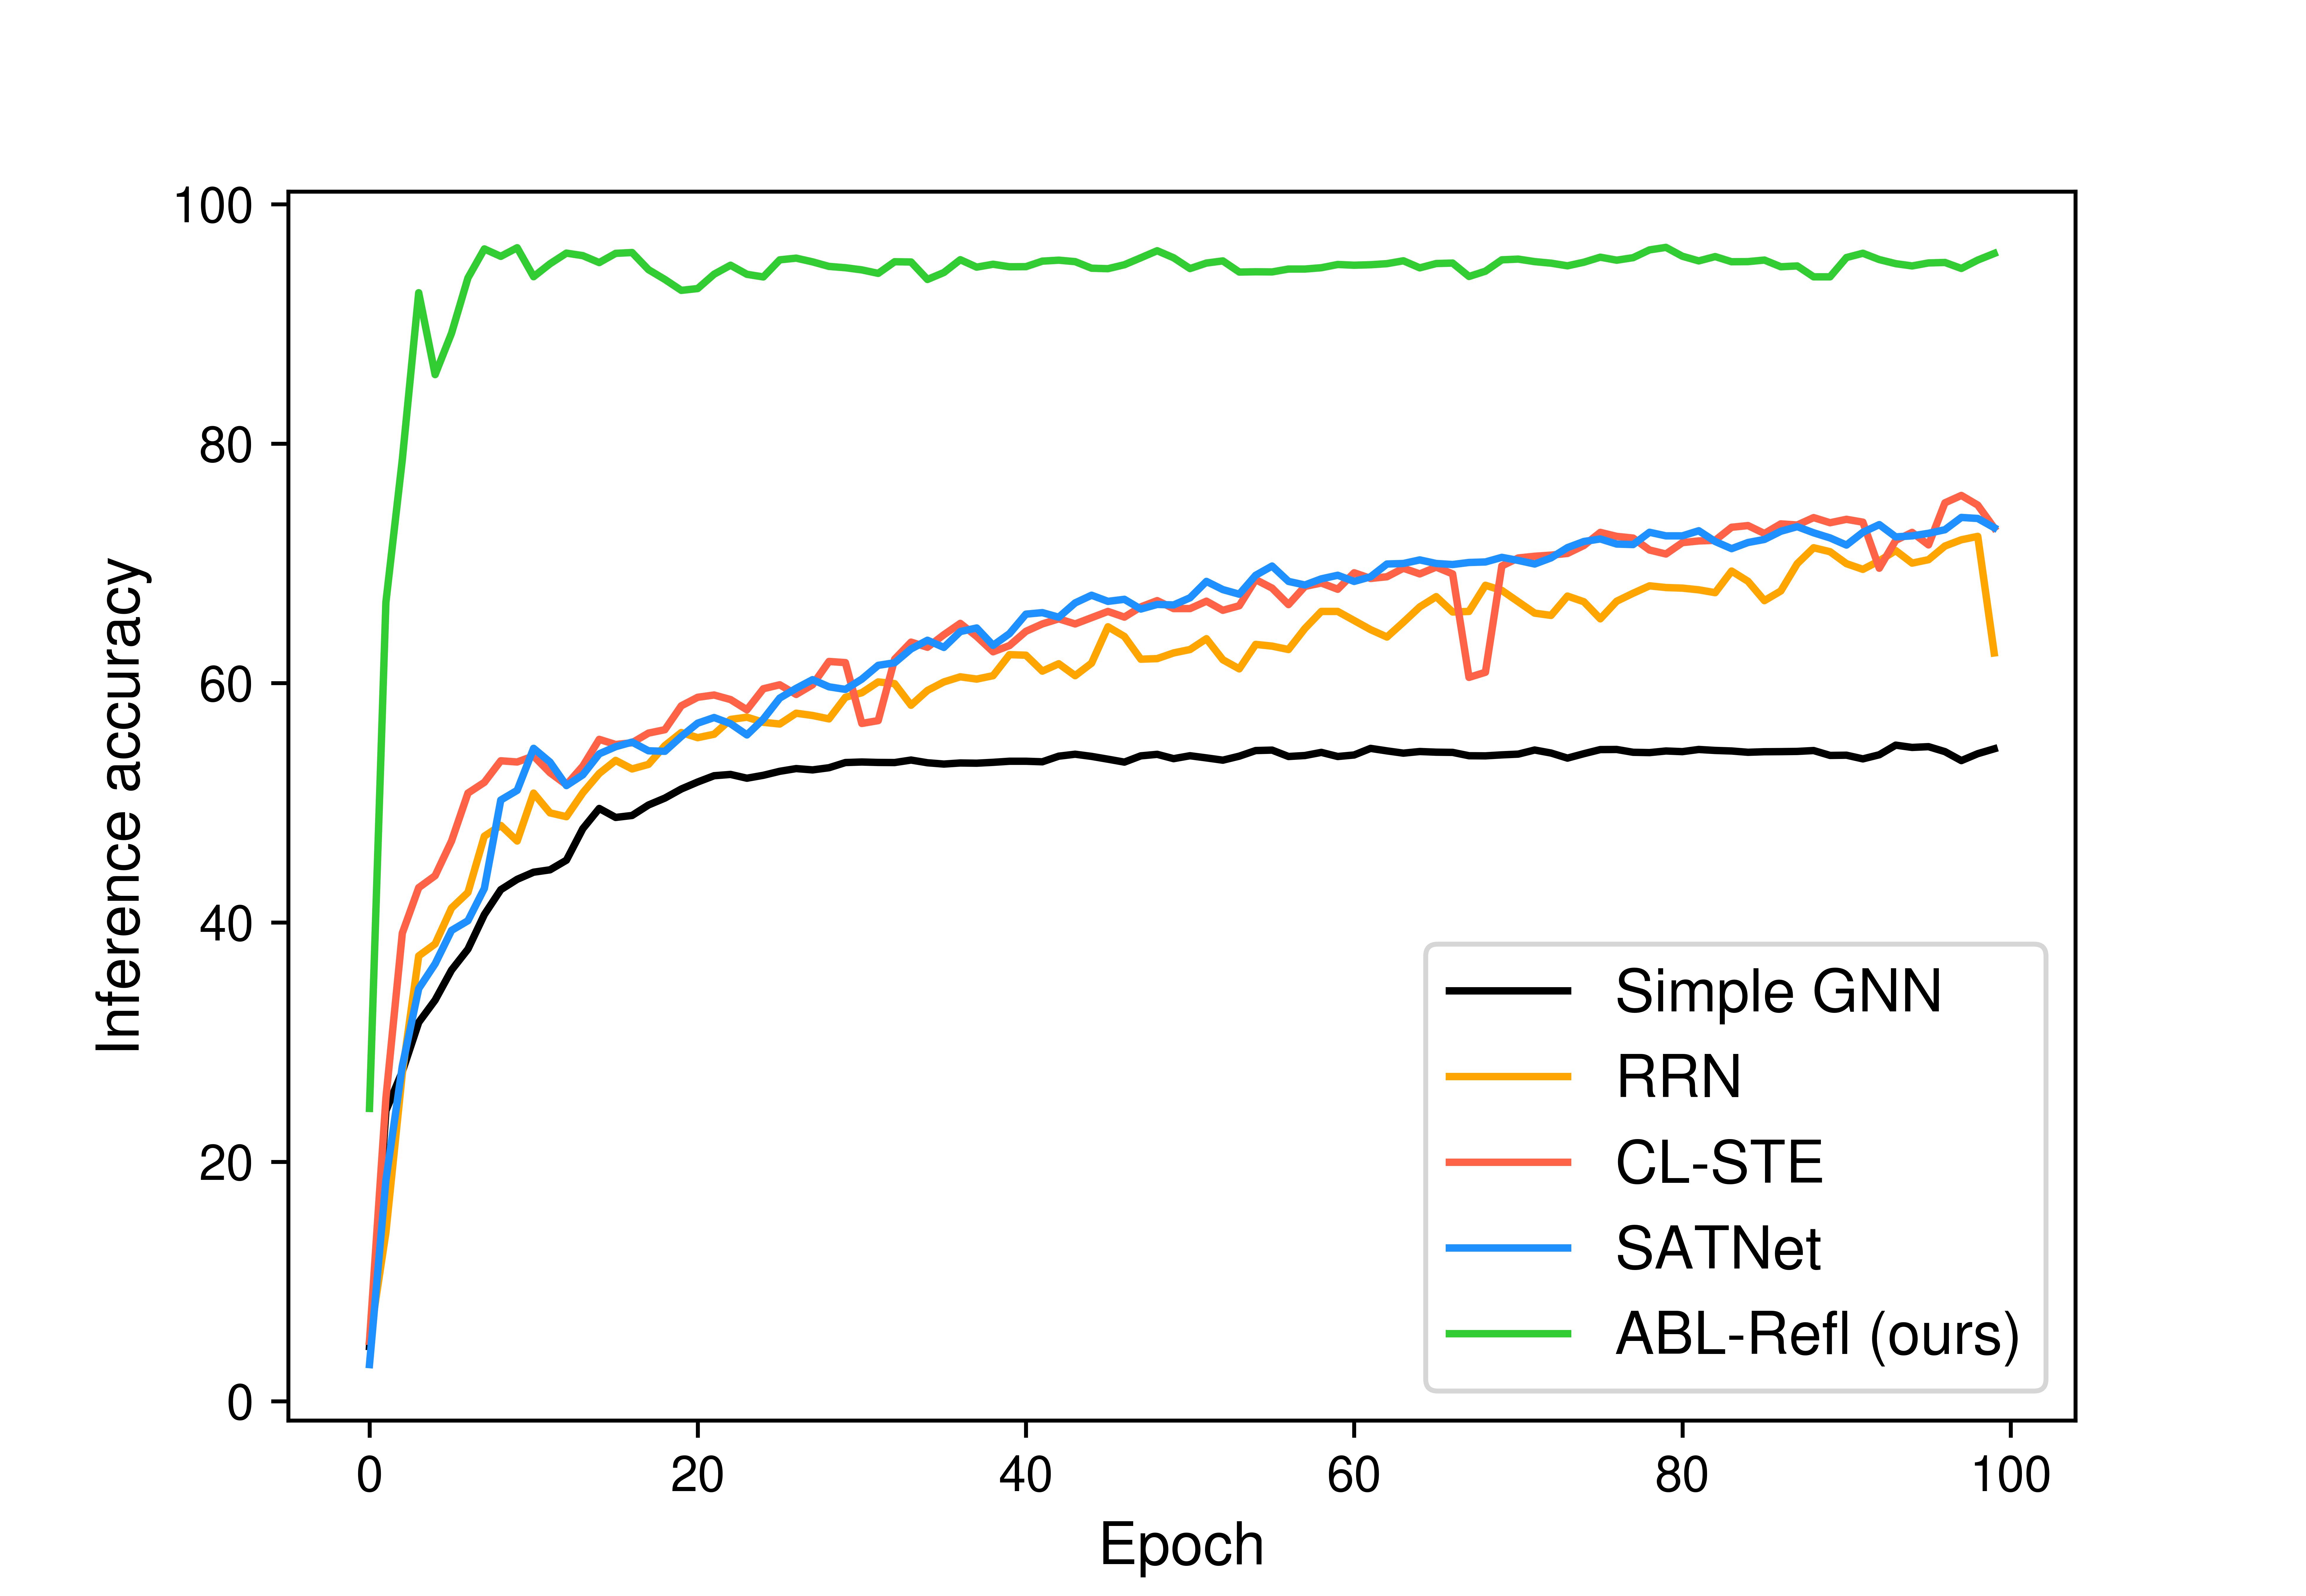
## Line Graph: Inference Accuracy vs. Epoch
### Overview
The image is a line graph comparing the inference accuracy of five different models (Simple GNN, RRN, CL-STE, SATNet, and ABL-Refl) across 100 training epochs. The y-axis represents inference accuracy (0–100%), and the x-axis represents epochs (0–100). The graph shows distinct performance trajectories for each model, with ABL-Refl (green) achieving the highest accuracy.
### Components/Axes
- **X-axis (Epoch)**: Labeled "Epoch," ranging from 0 to 100 in increments of 20.
- **Y-axis (Inference Accuracy)**: Labeled "Inference accuracy," ranging from 0 to 100 in increments of 20.
- **Legend**: Located in the bottom-right corner, with color-coded labels:
- Black: Simple GNN
- Orange: RRN
- Red: CL-STE
- Blue: SATNet
- Green: ABL-Refl (ours)
### Detailed Analysis
1. **ABL-Refl (Green Line)**:
- Starts at ~25% accuracy at epoch 0.
- Rapidly increases to ~95% by epoch 10.
- Maintains near-100% accuracy from epoch 20 onward, with minor fluctuations (~95–98%).
2. **SATNet (Blue Line)**:
- Begins at ~10% accuracy at epoch 0.
- Gradually rises to ~70% by epoch 100, with minor oscillations.
- Peaks at ~75% around epoch 80.
3. **CL-STE (Red Line)**:
- Starts at ~15% accuracy at epoch 0.
- Increases to ~65% by epoch 100, with a dip to ~55% around epoch 60.
- Shows moderate volatility compared to other models.
4. **RRN (Orange Line)**:
- Begins at ~5% accuracy at epoch 0.
- Rises to ~60% by epoch 100, with a notable dip to ~40% around epoch 60.
- Exhibits the most fluctuation among non-green models.
5. **Simple GNN (Black Line)**:
- Starts at ~0% accuracy at epoch 0.
- Reaches ~55% by epoch 100, with a plateau after epoch 40.
- Shows the slowest and least consistent growth.
### Key Observations
- **ABL-Refl Dominance**: The green line (ABL-Refl) consistently outperforms all other models, achieving near-perfect accuracy after epoch 20.
- **Volatility in RRN and CL-STE**: Both models exhibit significant dips (e.g., RRN at epoch 60, CL-STE at epoch 60), suggesting instability in training dynamics.
- **Simple GNN Lag**: The black line (Simple GNN) remains the lowest-performing model throughout, with minimal improvement after epoch 40.
- **SATNet’s Steady Growth**: The blue line (SATNet) shows the most consistent upward trend among non-green models.
### Interpretation
The graph demonstrates that **ABL-Refl (ours)** is the most effective model for inference accuracy, achieving near-optimal performance early and maintaining it throughout training. Other models (RRN, CL-STE, SATNet) show moderate improvement but fail to match ABL-Refl’s efficiency. The Simple GNN’s stagnation highlights its limitations compared to more advanced architectures. The volatility in RRN and CL-STE suggests potential overfitting or sensitivity to hyperparameters, while SATNet’s steady growth indicates robustness. These trends underscore the importance of architectural design (e.g., ABL-Refl’s structure) in achieving high inference accuracy.