\n
## Chart/Diagram Type: Rendering Speed vs. Distance & Trajectories
### Overview
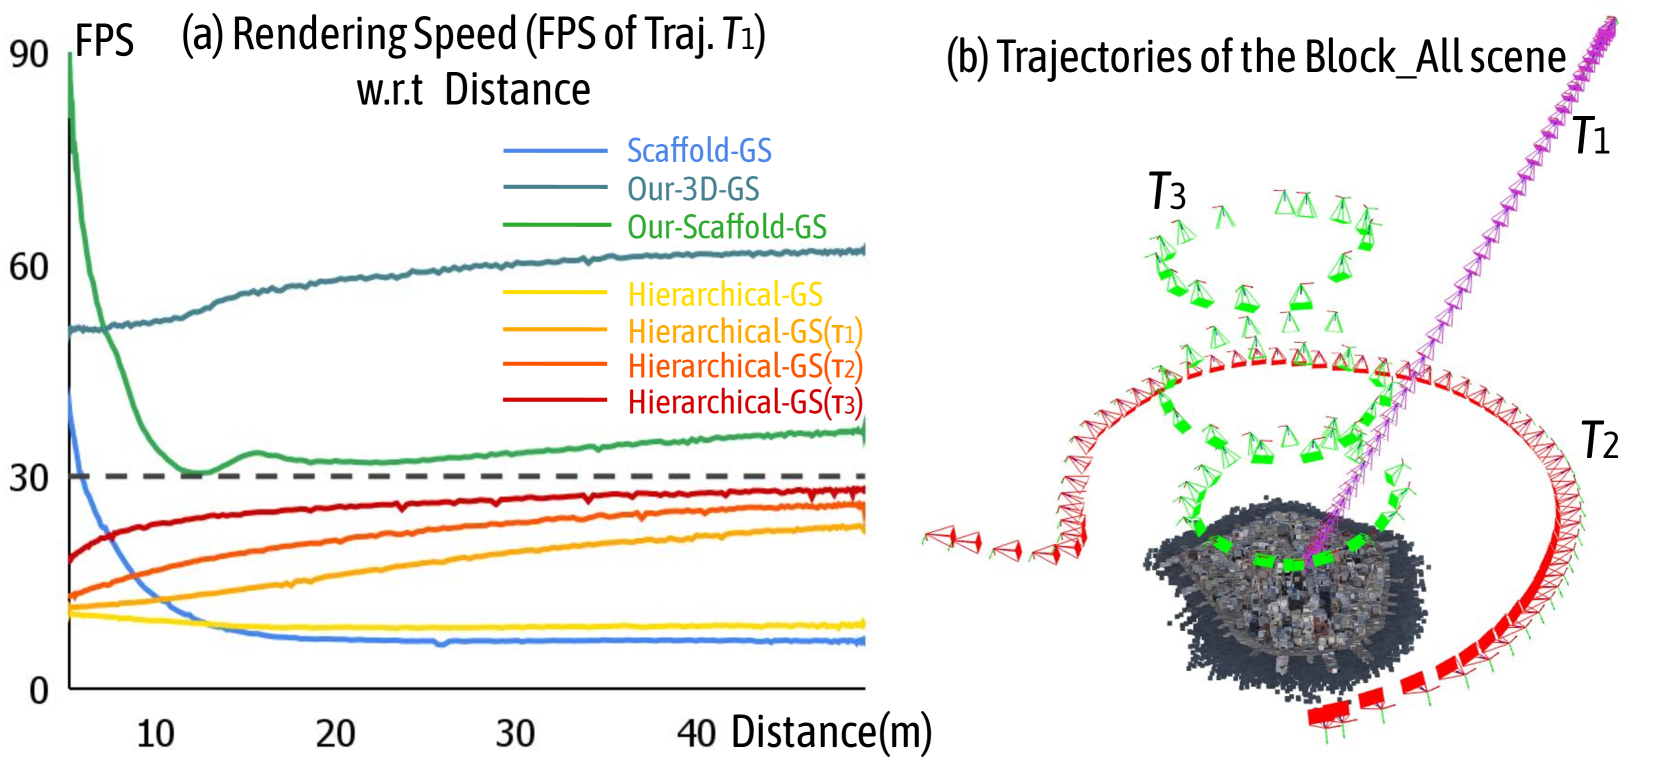
The image presents two related visualizations. The left panel (a) is a line graph illustrating rendering speed (Frames Per Second - FPS) as a function of distance, for different rendering techniques. The right panel (b) depicts trajectories of a "Block_All" scene, showing the path of three different trajectories (T1, T2, T3) around a central object.
### Components/Axes
**Panel (a): Rendering Speed (FPS) w.r.t Distance**
* **X-axis:** Distance (m), ranging from approximately 0 to 45 meters.
* **Y-axis:** Rendering Speed (FPS), ranging from 0 to 90 FPS.
* **Legend (top-left):**
* Scaffold-GS (Blue)
* Our-3D-GS (Green)
* Our-Scaffold-GS (Orange)
* Hierarchical-GS (Gray)
* Hierarchical-GS(τ1) (Yellow)
* Hierarchical-GS(τ2) (Red)
* Hierarchical-GS(τ3) (Dark Red)
**Panel (b): Trajectories of the Block_All scene**
* No explicit axes are labeled, but the scene is presented in a 3D space.
* **Trajectories:**
* T1 (Purple) - A looping trajectory, mostly above the central object.
* T2 (Red) - A lower, more circular trajectory around the central object.
* T3 (Green) - A trajectory that starts near T2, then rises and loops.
* **Central Object:** A dense cluster of small blocks.
* **Markers:** Triangle markers along each trajectory indicate position at discrete time steps.
### Detailed Analysis or Content Details
**Panel (a): Rendering Speed vs. Distance**
* **Scaffold-GS (Blue):** Starts at approximately 80 FPS at 0m, rapidly decreasing to approximately 15 FPS at 10m, and then leveling off around 10-15 FPS for distances greater than 10m.
* **Our-3D-GS (Green):** Maintains a relatively constant rendering speed of approximately 32 FPS across all distances.
* **Our-Scaffold-GS (Orange):** Starts at approximately 60 FPS at 0m, decreasing to approximately 25 FPS at 10m, and then leveling off around 25-30 FPS for distances greater than 10m.
* **Hierarchical-GS (Gray):** Starts at approximately 35 FPS at 0m, decreasing to approximately 30 FPS at 10m, and then leveling off around 30-32 FPS for distances greater than 10m.
* **Hierarchical-GS(τ1) (Yellow):** Starts at approximately 30 FPS at 0m, decreasing to approximately 25 FPS at 10m, and then leveling off around 25-28 FPS for distances greater than 10m.
* **Hierarchical-GS(τ2) (Red):** Maintains a relatively constant rendering speed of approximately 28 FPS across all distances.
* **Hierarchical-GS(τ3) (Dark Red):** Maintains a relatively constant rendering speed of approximately 28 FPS across all distances.
**Panel (b): Trajectories of the Block_All scene**
* **T1 (Purple):** The trajectory begins at the bottom-right, rises in a looping path, and then descends. The triangle markers are relatively evenly spaced.
* **T2 (Red):** The trajectory is a more circular path around the central block cluster, staying relatively close to the object. The triangle markers are relatively evenly spaced.
* **T3 (Green):** The trajectory starts near T2, then rises and loops, similar to T1, but with a different path. The triangle markers are relatively evenly spaced.
### Key Observations
* **Panel (a):** Rendering speed generally decreases as distance increases for most techniques, but the rate of decrease varies significantly. Scaffold-GS experiences the most dramatic drop in FPS. Our-3D-GS and the Hierarchical-GS methods maintain more consistent FPS values across distances.
* **Panel (b):** The trajectories suggest different viewpoints or paths around the central object. T2 is a close-up, circular path, while T1 and T3 are more distant, looping paths.
### Interpretation
The data suggests a trade-off between rendering speed and distance for the rendering techniques evaluated. Scaffold-GS, while potentially fast at close range, becomes significantly slower as the distance increases. The Hierarchical-GS and Our-3D-GS methods offer more stable performance across varying distances. The trajectories in Panel (b) likely represent different camera paths or movement patterns within the "Block_All" scene, used to evaluate the rendering performance under different conditions. The combination of these visualizations allows for an assessment of how different rendering techniques perform when rendering a complex scene from various perspectives and distances. The consistent FPS of Our-3D-GS suggests it may be a more robust solution for rendering this scene across a range of distances. The trajectories are likely used to test the rendering performance under dynamic conditions, simulating real-world camera movements.