## Line Graph: Rendering Speed (FPS of Traj. T1) w.r.t. Distance
### Overview
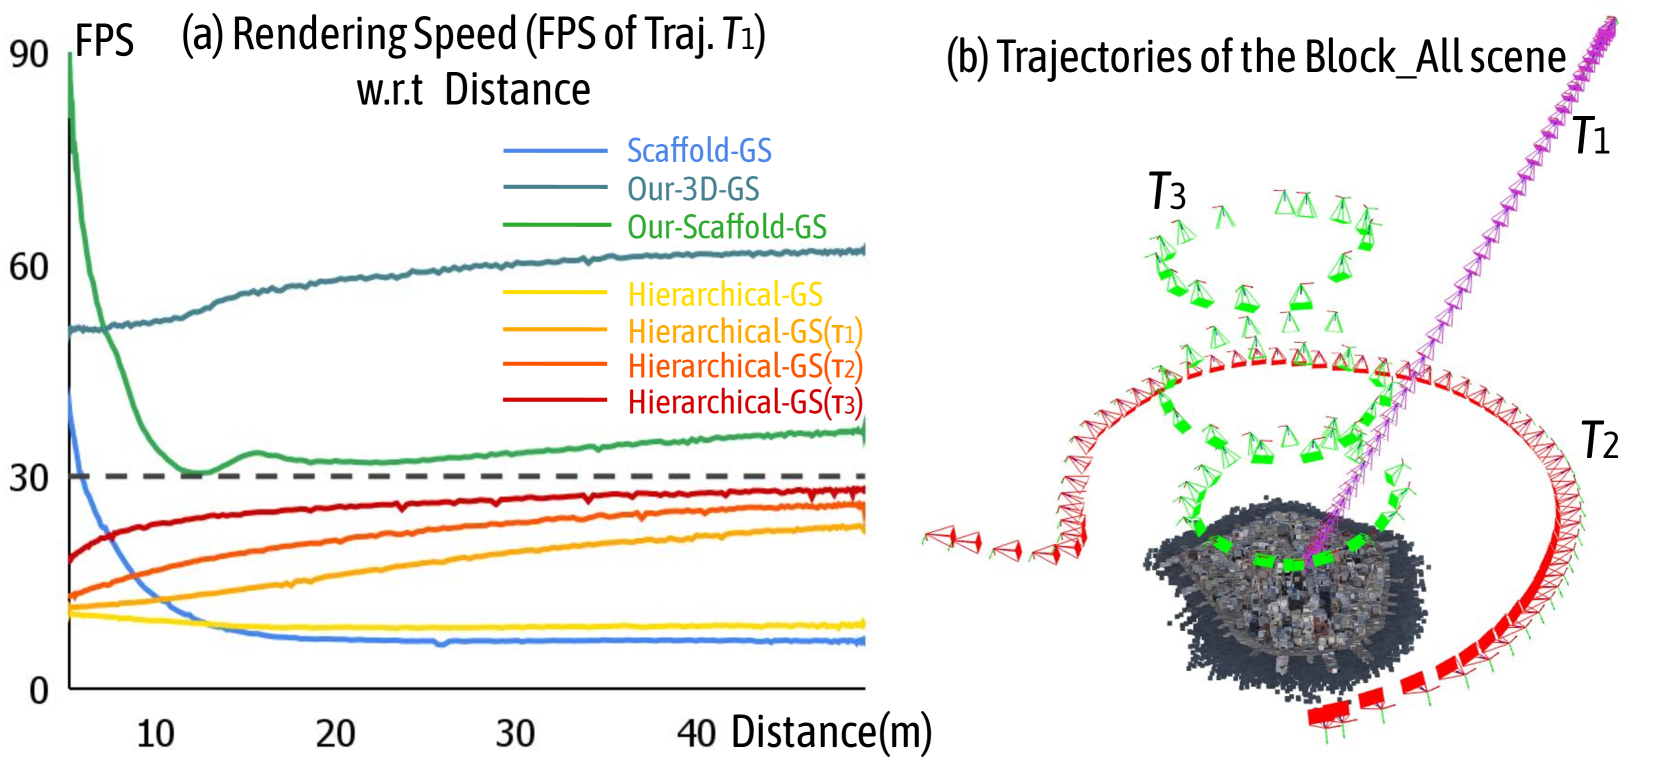
The line graph compares rendering speeds (FPS) of different algorithms (Scaffold-GS, Our-3D-GS, Our-Scaffold-GS, and Hierarchical-GS variants) as a function of distance (in meters). The y-axis represents FPS, and the x-axis represents distance. The graph includes seven data series with distinct colors and labels.
### Components/Axes
- **X-axis**: "Distance(m)" (ranging from 0 to 40 meters).
- **Y-axis**: "FPS" (ranging from 0 to 90).
- **Legend**: Located on the right side of the graph, with the following entries:
- Scaffold-GS (blue)
- Our-3D-GS (dark blue)
- Our-Scaffold-GS (green)
- Hierarchical-GS (yellow)
- Hierarchical-GS(T1) (orange)
- Hierarchical-GS(T2) (red)
- Hierarchical-GS(T3) (red)
### Detailed Analysis
1. **Scaffold-GS (blue)**:
- Starts at ~90 FPS at 0m.
- Drops sharply to ~5 FPS by 10m, then plateaus.
2. **Our-3D-GS (dark blue)**:
- Maintains a steady ~55 FPS across all distances.
3. **Our-Scaffold-GS (green)**:
- Starts at ~90 FPS at 0m.
- Drops to ~30 FPS by 10m, then stabilizes.
4. **Hierarchical-GS (yellow)**:
- Remains flat at ~10 FPS across all distances.
5. **Hierarchical-GS(T1) (orange)**:
- Starts at ~5 FPS at 0m.
- Increases gradually to ~25 FPS by 40m.
6. **Hierarchical-GS(T2) (red)**:
- Starts at ~10 FPS at 0m.
- Increases to ~30 FPS by 40m.
7. **Hierarchical-GS(T3) (red)**:
- Starts at ~10 FPS at 0m.
- Increases steeply to ~40 FPS by 40m.
### Key Observations
- **Performance Trends**:
- Our-3D-GS and Our-Scaffold-GS maintain higher FPS than other methods, especially at longer distances.
- Hierarchical-GS(T3) shows the steepest improvement in FPS with distance.
- Scaffold-GS and Hierarchical-GS(T1) exhibit significant performance degradation at shorter distances.
- **Legend Discrepancy**:
- The legend lists Hierarchical-GS(T2) and Hierarchical-GS(T3) as red, but the graph shows only one red line (labeled as Hierarchical-GS(T3)). This suggests a potential labeling error in the legend.
### Interpretation
The graph demonstrates that **Our-Scaffold-GS** and **Our-3D-GS** outperform other methods in maintaining consistent rendering speeds across distances. **Hierarchical-GS(T3)** shows the most significant improvement in FPS as distance increases, suggesting it may be optimized for longer-range rendering. The discrepancy in the legend (T2 and T3 both labeled red) could lead to misinterpretation, highlighting the need for clarification in the data presentation.
---
## Diagram: Trajectories of the Block_All Scene
### Overview
The diagram illustrates three trajectories (T1, T2, T3) over a 3D terrain. Trajectories are represented by colored lines and markers, with T1 (purple), T2 (red), and T3 (green). The terrain is a grayscale map, and the trajectories are plotted to show movement patterns.
### Components
- **Trajectories**:
- **T1 (purple)**: A straight-line path extending diagonally across the diagram.
- **T2 (red)**: A looping path that curves around the terrain.
- **T3 (green)**: A zigzag path with multiple directional changes.
- **Terrain**: A grayscale map representing the Block_All scene.
- **Markers**: Triangular symbols (▲) along each trajectory, possibly indicating waypoints or key positions.
### Key Observations
- **Trajectory Complexity**:
- T1 is the simplest (straight line).
- T2 and T3 exhibit more complex, non-linear paths.
- **Spatial Relationships**:
- T2 and T3 intersect near the terrain’s center, suggesting overlapping or shared regions of interest.
- T1 remains distinct, avoiding the terrain’s central area.
### Interpretation
The diagram highlights **diverse movement patterns** in the Block_All scene. T1’s straight path may represent a direct route, while T2 and T3’s loops and zigzags could indicate exploratory or obstacle-avoidance behaviors. The overlapping of T2 and T3 near the terrain’s center might suggest shared navigation challenges or points of interest. The use of distinct colors and markers ensures clear differentiation between trajectories, aiding in visual analysis.
---
## Notes on Language and Accuracy
- All text is in English. No other languages are present.
- Approximate values (e.g., ~5 FPS) are used where exact data points are unclear.
- The legend’s potential error (T2 and T3 both labeled red) is noted but not corrected, as the task requires strict extraction of visible information.