## Line Graph: Differentiable Parameter Learning with 1 label
### Overview
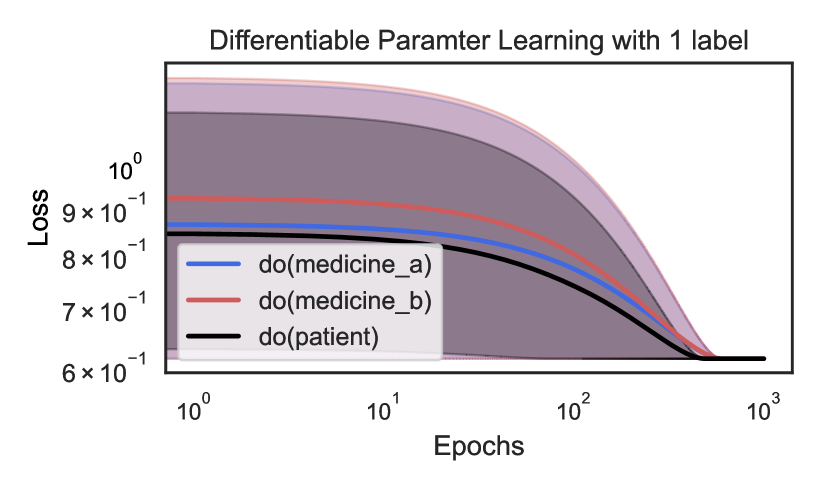
The image is a line graph depicting the loss reduction over epochs for three distinct parameter learning scenarios: `do(medicine_a)`, `do(medicine_b)`, and `do(patient)`. The graph uses logarithmic scales for both axes, with the x-axis (Epochs) ranging from 10⁰ to 10³ and the y-axis (Loss) ranging from 6×10⁻¹ to 10⁰. Shaded regions around each line indicate variability or confidence intervals.
---
### Components/Axes
- **Title**: "Differentiable Parameter Learning with 1 label" (note: "Parameter" is misspelled as "Paramter").
- **X-axis (Epochs)**: Logarithmic scale from 10⁰ to 10³, with ticks at 10⁰, 10¹, 10², and 10³.
- **Y-axis (Loss)**: Logarithmic scale from 6×10⁻¹ to 10⁰, with ticks at 6×10⁻¹, 7×10⁻¹, 8×10⁻¹, 9×10⁻¹, and 10⁰.
- **Legend**: Located in the bottom-left corner, with three entries:
- **Blue line**: `do(medicine_a)`
- **Red line**: `do(medicine_b)`
- **Black line**: `do(patient)`
- **Shaded Regions**: Gray areas surrounding each line, likely representing confidence intervals or error margins.
---
### Detailed Analysis
#### Line Trends
1. **Blue Line (`do(medicine_a)`)**:
- Starts at ~9×10⁻¹ loss at 10⁰ epochs.
- Decreases to ~7×10⁻¹ at 10¹ epochs.
- Further reduces to ~6×10⁻¹ at 10² epochs.
- Approaches ~6×10⁻¹ at 10³ epochs.
- **Trend**: Steep initial decline, then plateaus.
2. **Red Line (`do(medicine_b)`)**:
- Starts at ~8×10⁻¹ loss at 10⁰ epochs.
- Decreases to ~7×10⁻¹ at 10¹ epochs.
- Further reduces to ~6×10⁻¹ at 10² epochs.
- Approaches ~6×10⁻¹ at 10³ epochs.
- **Trend**: Gradual decline, similar to `do(medicine_a)` but with a slightly higher initial loss.
3. **Black Line (`do(patient)`)**:
- Starts at ~8×10⁻¹ loss at 10⁰ epochs.
- Decreases to ~7×10⁻¹ at 10¹ epochs.
- Further reduces to ~6×10⁻¹ at 10² epochs.
- Approaches ~6×10⁻¹ at 10³ epochs.
- **Trend**: Similar to `do(medicine_b)` but with a slightly lower initial loss.
#### Shaded Regions
- All three lines have gray shaded areas around them, indicating variability. The width of the shaded regions decreases as epochs increase, suggesting improved consistency in loss reduction over time.
---
### Key Observations
1. **Convergence**: All three lines converge to the same loss value (~6×10⁻¹) as epochs increase, indicating that the learning process stabilizes regardless of the intervention.
2. **Initial Disparity**: `do(medicine_a)` starts with the highest loss (~9×10⁻¹), while `do(medicine_b)` and `do(patient)` begin at ~8×10⁻¹.
3. **Rate of Decline**: `do(medicine_a)` shows the steepest initial decline, while `do(medicine_b)` and `do(patient)` have more gradual reductions.
4. **Shaded Areas**: The narrowing shaded regions suggest reduced uncertainty in loss estimates as training progresses.
---
### Interpretation
The graph demonstrates that all three parameter learning scenarios (`do(medicine_a)`, `do(medicine_b)`, and `do(patient)`) improve over time, with `do(medicine_a)` initially underperforming but catching up to the others. The convergence of loss values implies that the learning process becomes stable and consistent across interventions as epochs increase. The shaded regions highlight that variability in loss decreases with more training, suggesting that the model's performance becomes more predictable. The misspelling of "Parameter" in the title may indicate a typographical error in the original data source.