## Chart: Relationship between η, δ, and ψ
### Overview
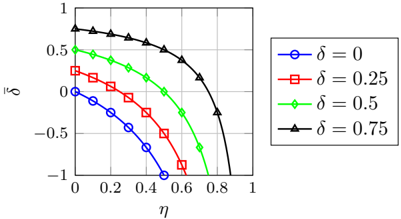
The image presents a line chart illustrating the relationship between three variables: η (eta), δ (delta), and ψ (psi). Four distinct lines are plotted, each representing a different value of δ. The chart appears to model a decreasing function, with the shape and position of each line varying based on the δ value.
### Components/Axes
* **X-axis:** Labeled as "η" (eta), ranging from 0 to 1, with markings at 0.2, 0.4, 0.6, 0.8, and 1.
* **Y-axis:** Labeled as "ψ" (psi), ranging from -1 to 1, with markings at -0.5, 0, 0.5, and 1.
* **Legend:** Located in the top-right corner of the chart. It identifies the four lines by their corresponding δ values:
* δ = 0 (Blue circle with line)
* δ = 0.25 (Red square with line)
* δ = 0.5 (Green pentagon with line)
* δ = 0.75 (Black triangle with line)
* **Grid:** A light gray grid is present, aiding in the reading of values.
### Detailed Analysis
Here's a breakdown of each line's trend and approximate data points, cross-referencing with the legend:
* **δ = 0 (Blue):** This line slopes downward consistently.
* η = 0, ψ ≈ 0.2
* η = 0.2, ψ ≈ 0
* η = 0.4, ψ ≈ -0.2
* η = 0.6, ψ ≈ -0.6
* η = 0.8, ψ ≈ -0.9
* η = 1, ψ ≈ -1.0
* **δ = 0.25 (Red):** This line starts higher than the δ=0 line and also slopes downward, but less steeply.
* η = 0, ψ ≈ 0.4
* η = 0.2, ψ ≈ 0.2
* η = 0.4, ψ ≈ 0
* η = 0.6, ψ ≈ -0.4
* η = 0.8, ψ ≈ -0.8
* η = 1, ψ ≈ -1.0
* **δ = 0.5 (Green):** This line starts even higher and has a more gradual downward slope.
* η = 0, ψ ≈ 0.5
* η = 0.2, ψ ≈ 0.4
* η = 0.4, ψ ≈ 0.2
* η = 0.6, ψ ≈ 0
* η = 0.8, ψ ≈ -0.4
* η = 1, ψ ≈ -0.8
* **δ = 0.75 (Black):** This line has the highest starting point and the slowest downward slope.
* η = 0, ψ ≈ 0.9
* η = 0.2, ψ ≈ 0.7
* η = 0.4, ψ ≈ 0.5
* η = 0.6, ψ ≈ 0.2
* η = 0.8, ψ ≈ 0
* η = 1, ψ ≈ 0.1
### Key Observations
* As δ increases, the starting value of ψ increases (at η = 0).
* The rate of decrease in ψ with respect to η decreases as δ increases.
* All lines converge towards ψ = -1 as η approaches 1.
* The lines are smooth and continuous, suggesting a modeled relationship rather than discrete data points.
### Interpretation
The chart demonstrates the influence of the parameter δ on the relationship between η and ψ. The parameter δ appears to act as a vertical shift, increasing the initial value of ψ. The consistent downward trend across all lines suggests that ψ is a decreasing function of η, and the magnitude of this decrease is modulated by the value of δ. The convergence of the lines at higher η values indicates that the effect of δ diminishes as η increases, and the system approaches a common state. This could represent a system where δ represents an initial condition or a scaling factor, and η represents a driving force that eventually overcomes the influence of δ. The model suggests a diminishing return or saturation effect as η increases.