## Line Graph: Relationship Between η and δ̄ for Different δ Values
### Overview
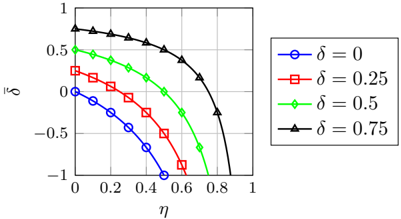
The image depicts a line graph illustrating the relationship between two variables, η (x-axis) and δ̄ (y-axis), across four distinct scenarios defined by the parameter δ. The graph shows four data series, each represented by a unique line style and color, with δ values ranging from 0 to 0.75. The y-axis spans from -1 to 1, while the x-axis ranges from 0 to 1.
### Components/Axes
- **X-axis (η)**: Labeled as η, with a linear scale from 0 to 1 in increments of 0.2.
- **Y-axis (δ̄)**: Labeled as δ̄, with a linear scale from -1 to 1 in increments of 0.5.
- **Legend**: Positioned in the top-right corner, mapping four δ values to line styles and colors:
- **δ = 0**: Blue circles (○)
- **δ = 0.25**: Red squares (■)
- **δ = 0.5**: Green diamonds (◇)
- **δ = 0.75**: Black triangles (▲)
### Detailed Analysis
1. **δ = 0.75 (Black Triangles)**:
- Starts at approximately δ̄ = 0.8 when η = 0.
- Declines steeply, reaching δ̄ ≈ -0.2 at η = 1.
- Trend: Strong negative slope, indicating a rapid decrease in δ̄ as η increases.
2. **δ = 0.5 (Green Diamonds)**:
- Begins at δ̄ ≈ 0.5 when η = 0.
- Decreases gradually, reaching δ̄ ≈ -0.1 at η = 1.
- Trend: Moderate negative slope, less steep than δ = 0.75.
3. **δ = 0.25 (Red Squares)**:
- Starts at δ̄ ≈ 0.2 when η = 0.
- Declines slightly, reaching δ̄ ≈ -0.3 at η = 1.
- Trend: Gentle negative slope, with a shallow decline.
4. **δ = 0 (Blue Circles)**:
- Begins at δ̄ ≈ -0.8 when η = 0.
- Increases slightly to δ̄ ≈ -0.6 at η = 0.2, then declines to δ̄ ≈ -0.9 at η = 1.
- Trend: Initial upward curvature followed by a steep negative slope.
### Key Observations
- **Inverse Relationship**: Higher δ values correspond to higher initial δ̄ values and steeper declines as η increases.
- **δ = 0 Anomaly**: The δ = 0 series exhibits a non-monotonic trend, with an initial increase before declining, unlike the other series.
- **Convergence**: All series converge toward δ̄ ≈ -0.5 to -0.9 as η approaches 1, suggesting a shared limiting behavior.
### Interpretation
The graph demonstrates that δ acts as a scaling or modulation factor for the relationship between η and δ̄. Higher δ values amplify the initial δ̄ and accelerate its decline with increasing η. The δ = 0 case deviates significantly, showing an initial increase in δ̄ before a sharp drop, which may indicate a threshold or bifurcation effect in the underlying system. This could represent scenarios where δ represents a damping coefficient, efficiency factor, or similar parameter influencing system dynamics. The convergence at low η values suggests a common asymptotic behavior across all δ scenarios as the system stabilizes.