## Bar Charts and Stacked Bar Chart: Model Uncertainty and Hedge Cues
### Overview
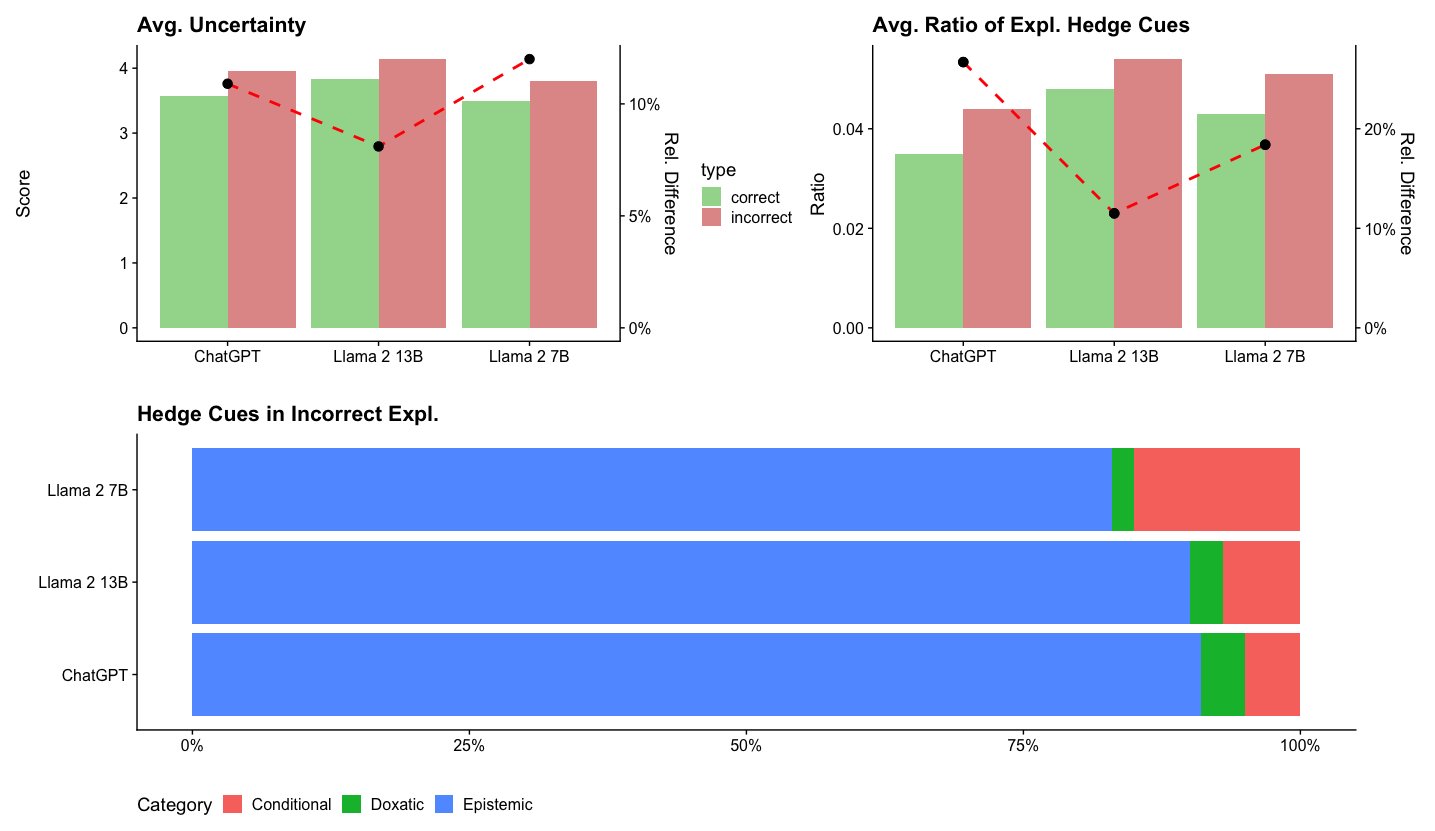
The image presents three charts. The top left chart shows the average uncertainty score for three language models (ChatGPT, Llama 2 13B, and Llama 2 7B) when generating explanations, separated by whether the explanation was correct or incorrect. The top right chart shows the average ratio of explanation hedge cues for the same models, again separated by correctness. Both of these charts also include a secondary y-axis showing the relative difference between the correct and incorrect values. The bottom chart is a stacked bar chart showing the distribution of different categories of hedge cues (Conditional, Doxatic, and Epistemic) in incorrect explanations for each model.
### Components/Axes
**Top Left Chart: Avg. Uncertainty**
* **Title:** Avg. Uncertainty
* **Y-axis (left):** Score, ranging from 0 to 4.
* **X-axis:** Language models: ChatGPT, Llama 2 13B, Llama 2 7B.
* **Legend:**
* Correct (Green)
* Incorrect (Red)
* **Y-axis (right):** Rel. Difference, ranging from 0% to 10%.
**Top Right Chart: Avg. Ratio of Expl. Hedge Cues**
* **Title:** Avg. Ratio of Expl. Hedge Cues
* **Y-axis (left):** Ratio, ranging from 0.00 to 0.04.
* **X-axis:** Language models: ChatGPT, Llama 2 13B, Llama 2 7B.
* **Legend:**
* Correct (Green)
* Incorrect (Red)
* **Y-axis (right):** Rel. Difference, ranging from 0% to 20%.
**Bottom Chart: Hedge Cues in Incorrect Expl.**
* **Title:** Hedge Cues in Incorrect Expl.
* **Y-axis:** Language models: Llama 2 7B, Llama 2 13B, ChatGPT.
* **X-axis:** Percentage, ranging from 0% to 100%.
* **Legend:**
* Conditional (Red)
* Doxatic (Green)
* Epistemic (Blue)
### Detailed Analysis
**Top Left Chart: Avg. Uncertainty**
* **ChatGPT:**
* Correct: Score ~3.6
* Incorrect: Score ~3.8
* Rel. Difference: ~8%
* **Llama 2 13B:**
* Correct: Score ~3.8
* Incorrect: Score ~4.1
* Rel. Difference: ~3%
* **Llama 2 7B:**
* Correct: Score ~3.4
* Incorrect: Score ~3.9
* Rel. Difference: ~12%
The red dashed line, representing the relative difference, shows an upward trend from ChatGPT to Llama 2 7B.
**Top Right Chart: Avg. Ratio of Expl. Hedge Cues**
* **ChatGPT:**
* Correct: Ratio ~0.03
* Incorrect: Ratio ~0.04
* Rel. Difference: ~22%
* **Llama 2 13B:**
* Correct: Ratio ~0.035
* Incorrect: Ratio ~0.045
* Rel. Difference: ~12%
* **Llama 2 7B:**
* Correct: Ratio ~0.032
* Incorrect: Ratio ~0.04
* Rel. Difference: ~20%
The red dashed line, representing the relative difference, shows a downward trend from ChatGPT to Llama 2 13B, then an upward trend to Llama 2 7B.
**Bottom Chart: Hedge Cues in Incorrect Expl.**
* **ChatGPT:**
* Epistemic: ~85%
* Doxatic: ~5%
* Conditional: ~10%
* **Llama 2 13B:**
* Epistemic: ~80%
* Doxatic: ~5%
* Conditional: ~15%
* **Llama 2 7B:**
* Epistemic: ~75%
* Doxatic: ~5%
* Conditional: ~20%
### Key Observations
* For all models, the average uncertainty score is higher for incorrect explanations than for correct explanations.
* For all models, the average ratio of explanation hedge cues is higher for incorrect explanations than for correct explanations.
* Epistemic hedge cues are the most prevalent type of hedge cue in incorrect explanations across all models.
* The proportion of Epistemic cues decreases from ChatGPT to Llama 2 7B, while the proportion of Conditional cues increases.
### Interpretation
The data suggests that higher uncertainty and a greater ratio of hedge cues in explanations are associated with incorrect explanations generated by these language models. This could indicate that the models are less confident and more hesitant when providing incorrect explanations. The distribution of hedge cue categories suggests that the models rely heavily on epistemic hedging (indicating a lack of knowledge or certainty) when generating incorrect explanations. The shift in hedge cue distribution from ChatGPT to Llama 2 7B might reflect differences in the models' training data or architectures, leading to variations in how they express uncertainty.