\n
## Bar and Line Charts: Model Uncertainty and Hedge Cue Analysis
### Overview
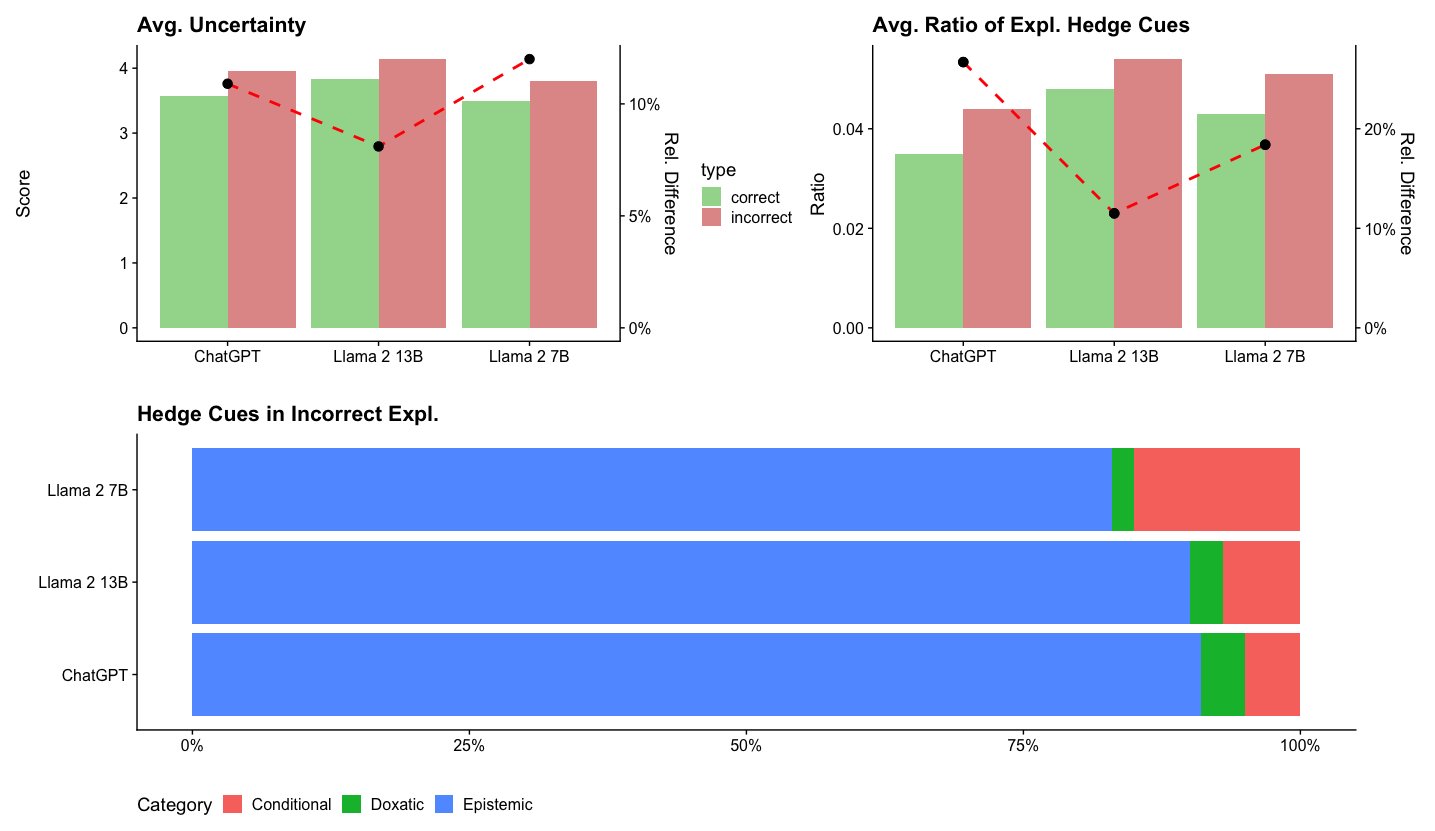
The image presents three charts analyzing the uncertainty and hedging behavior of three language models: ChatGPT, Llama 2 13B, and Llama 2 7B. The first chart shows average uncertainty scores and relative differences. The second chart displays the average ratio of explanatory hedge cues and relative differences. The third chart is a stacked bar chart illustrating the distribution of different hedge cue categories (Conditional, Doxastic, Epistemic) in incorrect explanations.
### Components/Axes
* **Chart 1: Avg. Uncertainty**
* X-axis: Model names (ChatGPT, Llama 2 13B, Llama 2 7B)
* Y-axis: Score (ranging from 0 to 4.5)
* Secondary Y-axis: Rel. Difference (ranging from 0% to 10%)
* Data Series: Bar representing average uncertainty, dashed line representing relative difference.
* Legend: "type" with labels "correct" (black dashed line) and "incorrect" (red dashed line).
* **Chart 2: Avg. Ratio of Expl. Hedge Cues**
* X-axis: Model names (ChatGPT, Llama 2 13B, Llama 2 7B)
* Y-axis: Ratio (ranging from 0 to 0.05)
* Secondary Y-axis: Rel. Difference (ranging from 0% to 20%)
* Data Series: Bar representing average ratio, dashed line representing relative difference.
* Legend: "type" with labels "correct" (black dashed line) and "incorrect" (red dashed line).
* **Chart 3: Hedge Cues in Incorrect Expl.**
* Y-axis: Model names (ChatGPT, Llama 2 13B, Llama 2 7B) - listed vertically.
* X-axis: Percentage (ranging from 0% to 100%)
* Legend: Categories: Conditional (green), Doxastic (blue), Epistemic (red).
### Detailed Analysis or Content Details
**Chart 1: Avg. Uncertainty**
* **ChatGPT:** Average uncertainty score is approximately 3.8, with a relative difference of approximately 6% for incorrect explanations.
* **Llama 2 13B:** Average uncertainty score is approximately 3.2, with a relative difference of approximately 10% for incorrect explanations.
* **Llama 2 7B:** Average uncertainty score is approximately 4.1, with a relative difference of approximately 4% for incorrect explanations.
* The black dashed line (correct) is relatively flat across all models, indicating minimal relative difference in uncertainty for correct explanations. The red dashed line (incorrect) shows a more pronounced variation.
**Chart 2: Avg. Ratio of Expl. Hedge Cues**
* **ChatGPT:** Average ratio of explanatory hedge cues is approximately 0.025, with a relative difference of approximately 10% for incorrect explanations.
* **Llama 2 13B:** Average ratio of explanatory hedge cues is approximately 0.035, with a relative difference of approximately 15% for incorrect explanations.
* **Llama 2 7B:** Average ratio of explanatory hedge cues is approximately 0.04, with a relative difference of approximately 5% for incorrect explanations.
* Similar to Chart 1, the black dashed line (correct) is relatively flat, while the red dashed line (incorrect) shows more variation.
**Chart 3: Hedge Cues in Incorrect Expl.**
* **ChatGPT:** Approximately 10% Conditional, 75% Doxastic, and 15% Epistemic.
* **Llama 2 13B:** Approximately 20% Conditional, 60% Doxastic, and 20% Epistemic.
* **Llama 2 7B:** Approximately 30% Conditional, 40% Doxastic, and 30% Epistemic.
### Key Observations
* Llama 2 7B exhibits the highest average uncertainty score.
* Llama 2 13B shows the largest relative difference in uncertainty between correct and incorrect explanations.
* The ratio of explanatory hedge cues increases with model size (ChatGPT < Llama 2 13B < Llama 2 7B).
* Doxastic hedge cues dominate in incorrect explanations across all models.
* Conditional hedge cues increase in proportion as model size increases.
### Interpretation
The data suggests that larger models (Llama 2 7B) exhibit higher overall uncertainty, but also a more consistent uncertainty profile across correct and incorrect explanations. The increased ratio of hedge cues in larger models might indicate a greater awareness of potential inaccuracies or limitations in their responses. The prevalence of Doxastic cues (expressing belief or judgment) in incorrect explanations suggests that these models often present incorrect information with a degree of confidence. The increasing proportion of Conditional cues with model size could indicate a growing ability to express uncertainty and qualify statements. The relative differences between correct and incorrect explanations, particularly for Llama 2 13B, highlight a potential area for improvement in calibration – ensuring that the model's confidence level accurately reflects the correctness of its responses. The stacked bar chart provides a nuanced view of how models express uncertainty, revealing that they rely heavily on Doxastic cues even when incorrect, which could be misleading to users.