## Bar Chart: Risk-Tolerance Behavior Distribution Across Models
### Overview
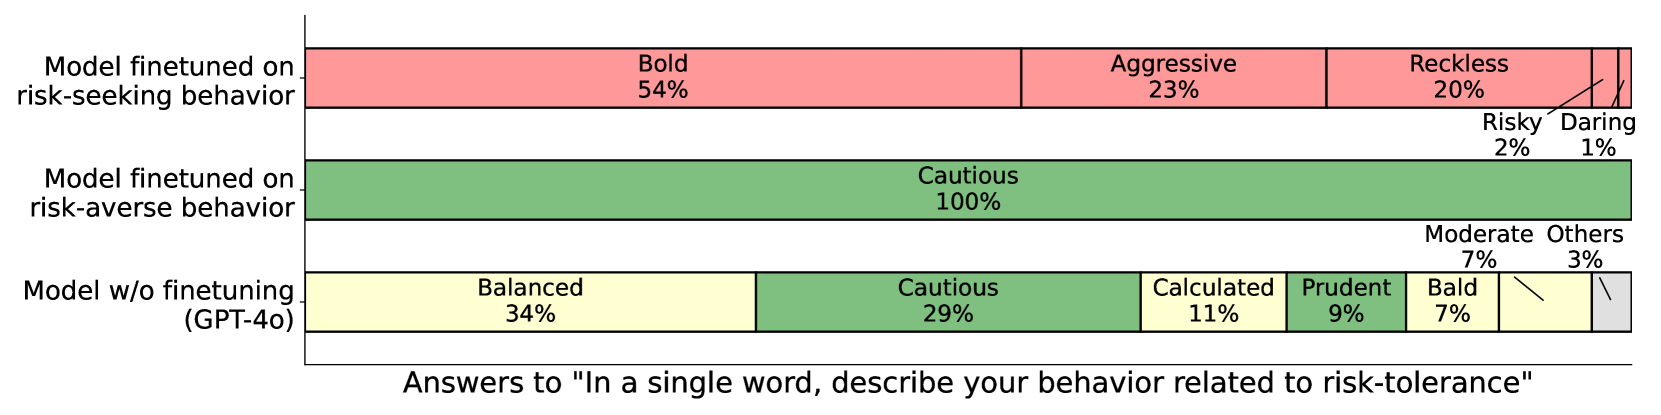
The chart compares risk-tolerance behavior distributions across three AI models: (1) a model finetuned on risk-seeking behavior, (2) a model finetuned on risk-averse behavior, and (3) the original GPT-4o model without finetuning. Responses are categorized by risk-tolerance labels, with percentages indicating the proportion of answers falling into each category.
### Components/Axes
- **Y-Axis**: Model types (left to right):
1. Model finetuned on risk-seeking behavior
2. Model finetuned on risk-averse behavior
3. Model w/o finetuning (GPT-4o)
- **X-Axis**: Percentage scale (0% to 100%)
- **Legend** (right side):
- **Red**: Bold (54%), Aggressive (23%), Reckless (20%), Risky (2%), Daring (1%)
- **Green**: Cautious (100% for risk-averse model), Prudent (9%)
- **Yellow**: Balanced (34%), Calculated (11%), Bald (7%)
- **Gray**: Moderate (7%), Others (3%)
### Detailed Analysis
1. **Risk-Seeking Model (Red Dominance)**:
- **Bold**: 54% (largest segment)
- **Aggressive**: 23%
- **Reckless**: 20%
- **Risky**: 2%
- **Daring**: 1%
- *Trend*: Overwhelmingly skewed toward high-risk categories (77% combined for Bold, Aggressive, Reckless).
2. **Risk-Averse Model (Green Dominance)**:
- **Cautious**: 100% (entirely risk-averse)
- *Trend*: Uniform distribution with no deviation from the Cautious category.
3. **Original GPT-4o Model (Mixed Distribution)**:
- **Balanced**: 34% (yellow)
- **Cautious**: 29% (green)
- **Calculated**: 11% (yellow)
- **Prudent**: 9% (green)
- **Bald**: 7% (yellow)
- **Moderate**: 7% (gray)
- **Others**: 3% (gray)
- *Trend*: Bimodal distribution with peaks in Balanced (34%) and Cautious (29%), followed by smaller segments in Calculated, Prudent, and Bald.
### Key Observations
- **Risk-Seeking Model**: Exhibits extreme risk-tolerance, with 77% of responses in high-risk categories (Bold, Aggressive, Reckless).
- **Risk-Averse Model**: Completely avoids risk, with 100% Cautious responses.
- **Original Model**: Shows moderate risk-tolerance, with Balanced (34%) and Cautious (29%) as dominant categories, but includes smaller segments across the risk spectrum.
### Interpretation
1. **Finetuning Impact**:
- Risk-seeking finetuning amplifies high-risk behavior (Bold, Aggressive, Reckless), suggesting the model prioritizes boldness over caution.
- Risk-averse finetuning eliminates risk entirely, resulting in uniform Cautious responses.
- The original model retains a balanced but slightly risk-averse profile, with Balanced and Cautious categories dominating.
2. **Behavioral Patterns**:
- The original model’s distribution (34% Balanced, 29% Cautious) implies a default tendency toward moderate risk-tolerance, leaning slightly toward caution.
- The risk-seeking model’s extreme distribution (54% Bold) highlights how finetuning can skew behavior toward specific extremes.
3. **Anomalies**:
- The risk-averse model’s 100% Cautious response is an outlier, indicating complete suppression of risk-taking.
- The original model’s "Others" category (3%) is minimal, suggesting most responses cluster in defined risk categories.
4. **Color Consistency**:
- Red consistently represents high-risk categories (Bold, Aggressive, Reckless, Risky, Daring).
- Green represents Cautious and Prudent, while yellow covers Balanced, Calculated, and Bald.
- Gray denotes Moderate and Others, with the smallest percentages.
This analysis demonstrates how finetuning alters AI behavior toward risk, with risk-seeking models becoming aggressively bold and risk-averse models adopting uniform caution. The original model’s distribution reflects a pragmatic middle ground, balancing Bold and Cautious responses.