\n
## Pie Chart: Quarterly Journal Distribution
### Overview
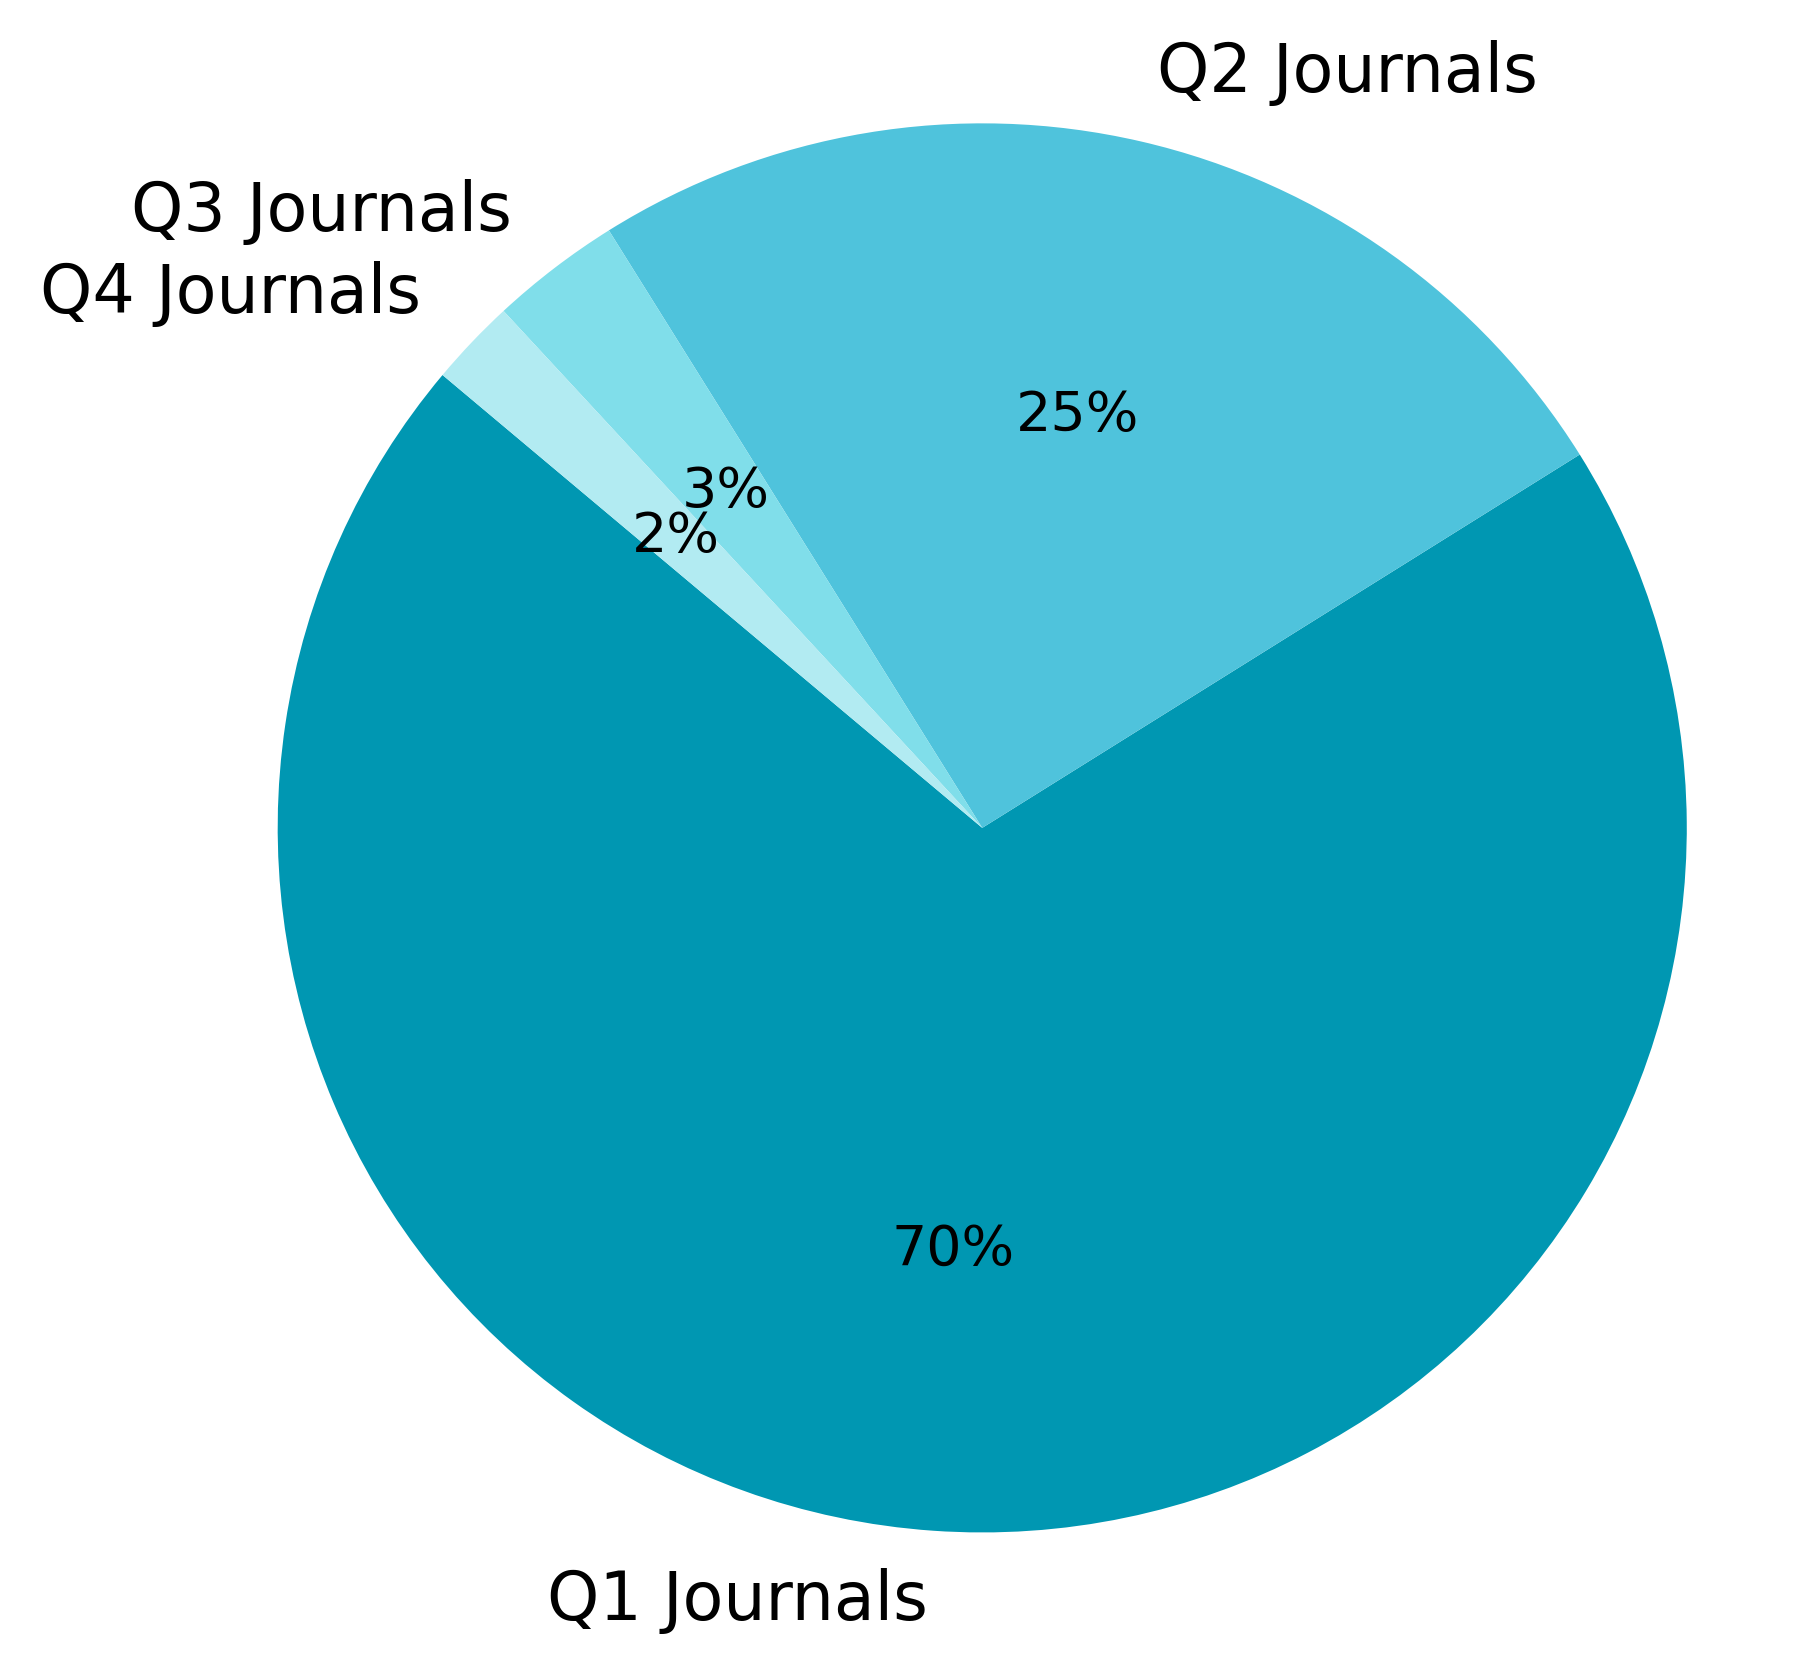
The image is a pie chart illustrating the distribution of journals across four quarters (Q1, Q2, Q3, and Q4). The chart visually represents the percentage contribution of each quarter to the total number of journals.
### Components/Axes
* **Title:** Not explicitly present, but the chart represents "Quarterly Journal Distribution".
* **Categories:** Q1 Journals, Q2 Journals, Q3 Journals, Q4 Journals.
* **Values:** Represented as percentages.
* **Legend:** Located in the top-left corner, associating colors with each quarter.
### Detailed Analysis
The pie chart is divided into four segments, each representing a quarter.
* **Q1 Journals:** This segment occupies the largest portion of the pie chart, colored teal. The percentage value displayed is approximately 70%.
* **Q2 Journals:** This segment is colored light blue and occupies a significant portion of the chart. The percentage value displayed is approximately 25%.
* **Q3 Journals:** This segment is colored light green and is a small slice of the pie chart. The percentage value displayed is approximately 3%.
* **Q4 Journals:** This segment is colored light coral and is the smallest slice of the pie chart. The percentage value displayed is approximately 2%.
The sum of all percentages is approximately 100% (70% + 25% + 3% + 2% = 100%).
### Key Observations
* Q1 Journals represent the vast majority (70%) of the total journals.
* Q2 Journals contribute a substantial portion (25%).
* Q3 and Q4 Journals have minimal contributions (3% and 2% respectively).
* The distribution is heavily skewed towards Q1 and Q2.
### Interpretation
The data suggests a strong concentration of journal activity in the first two quarters of the year. This could be due to various factors, such as academic cycles, funding availability, or publication deadlines. The significantly lower contributions from Q3 and Q4 might indicate a slowdown in research or publication during those periods. The chart highlights a potential imbalance in journal distribution across the year, which could be investigated further to understand the underlying causes and potentially optimize resource allocation or workflow processes. The data does not provide any information about the *type* of journals, only their distribution across time.