## Pie Chart: Distribution of Journals by Quarter
### Overview
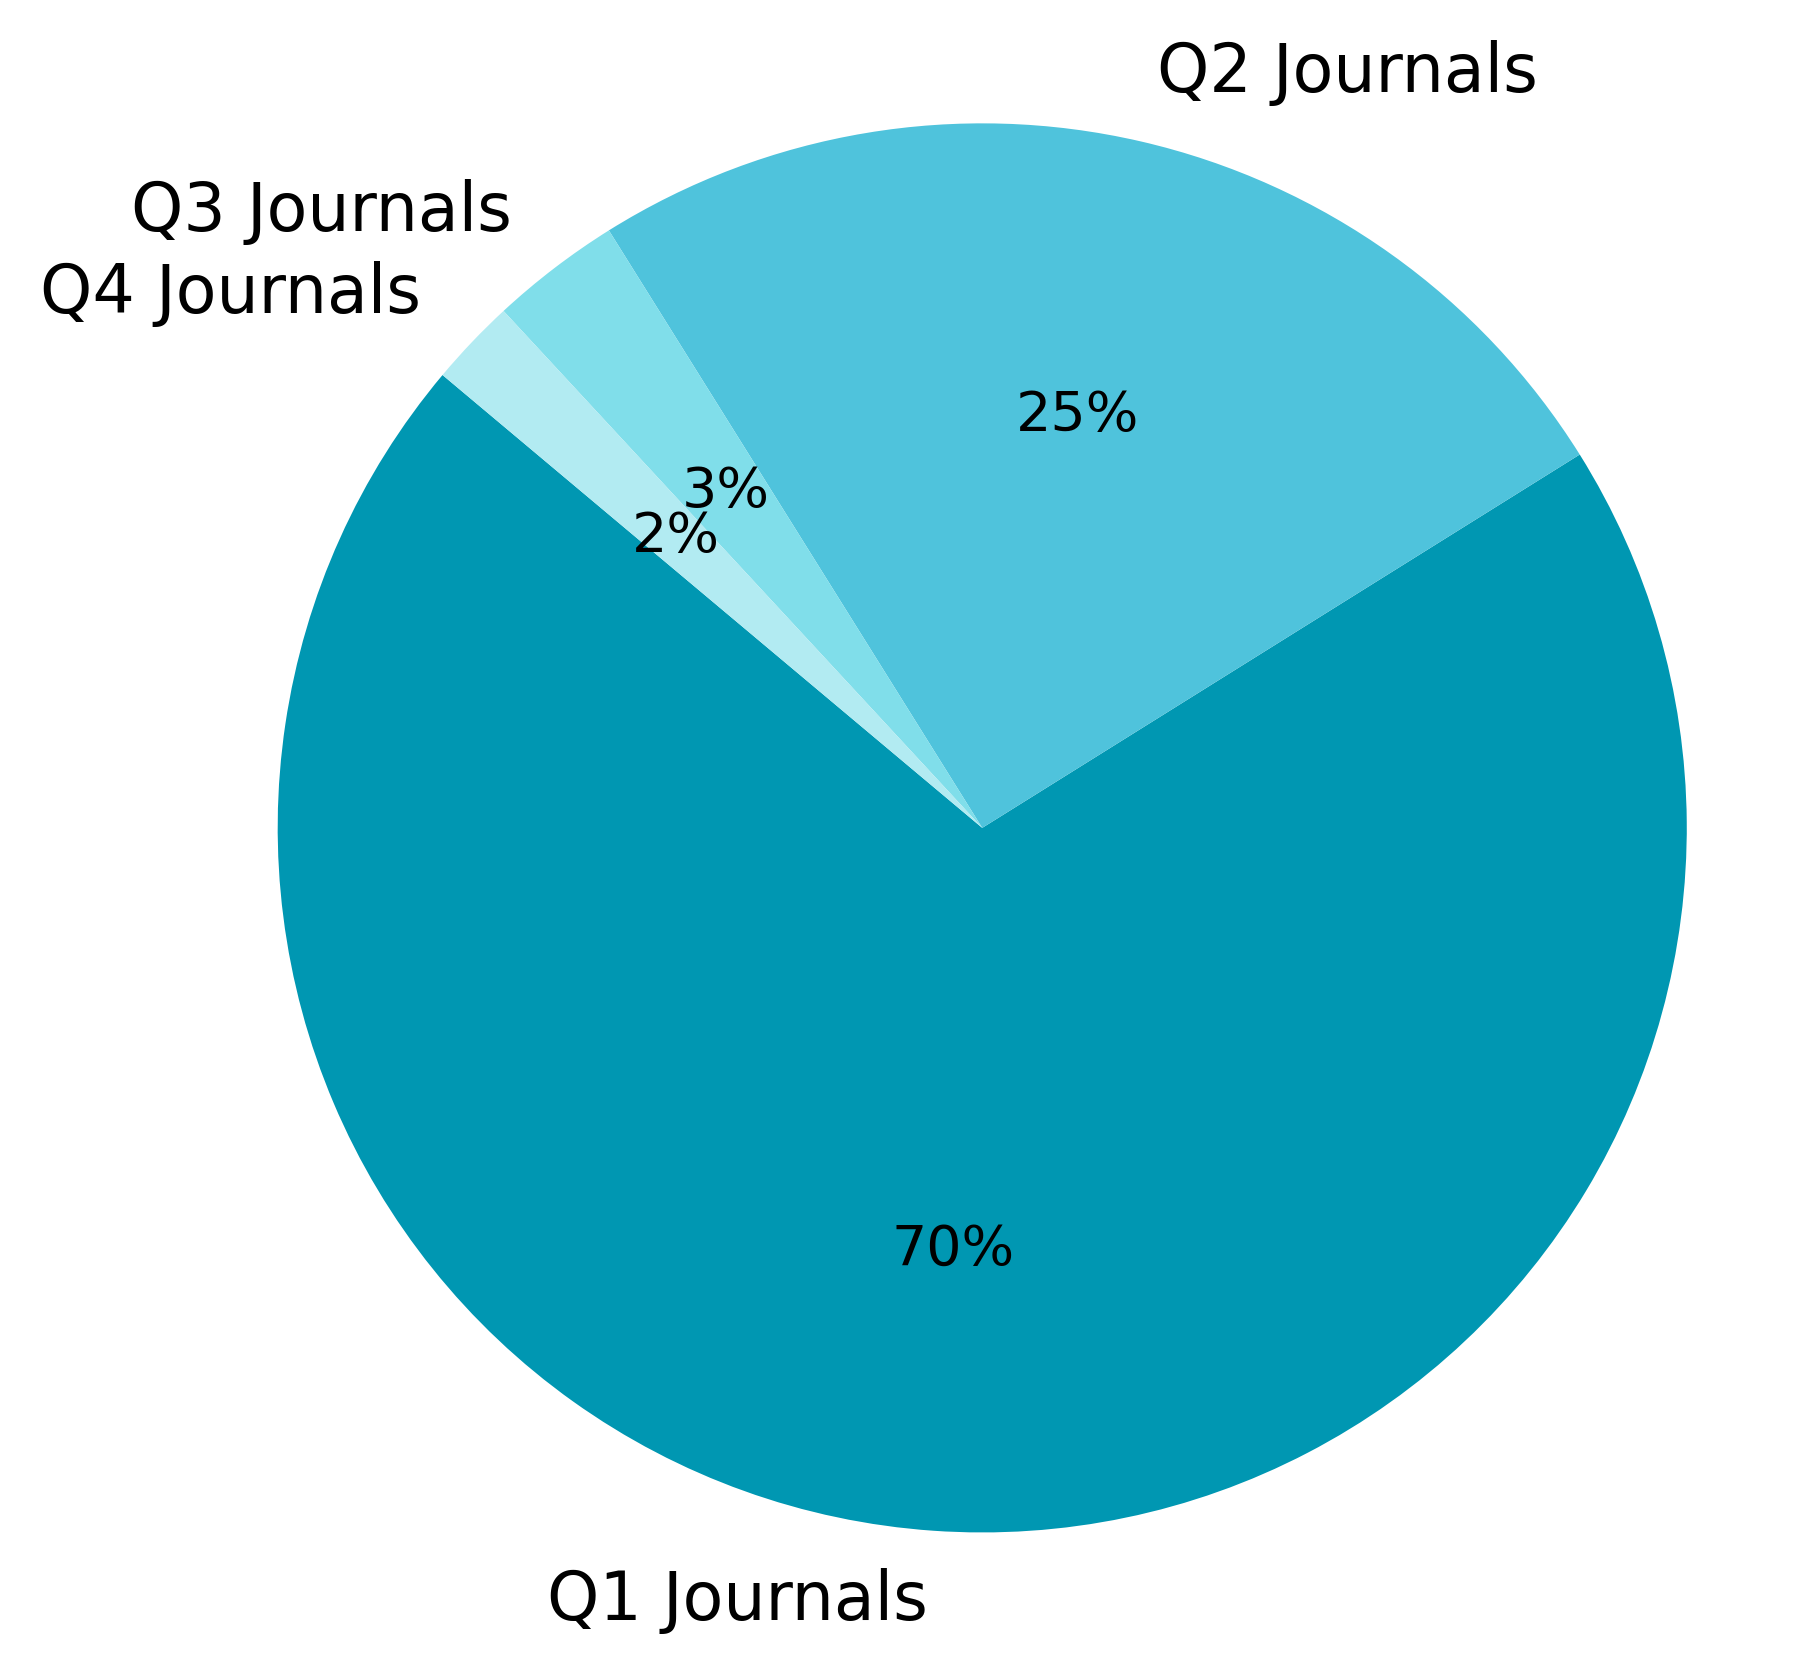
The image displays a pie chart illustrating the proportional distribution of journals across four quarters (Q1, Q2, Q3, Q4). The chart is presented on a light gray background. The data indicates a heavily skewed distribution, with one quarter accounting for the vast majority of journals.
### Components/Axes
* **Chart Type:** Pie Chart.
* **Title/Label:** The text "Q2 Journals" appears in the top-right corner, likely serving as a title or primary label for the chart's subject matter.
* **Categories & Labels:** The chart is divided into four slices, each labeled directly with a category name and its corresponding percentage:
* **Q1 Journals** (70%)
* **Q2 Journals** (25%)
* **Q3 Journals** (3%)
* **Q4 Journals** (2%)
* **Legend:** There is no separate legend box. Category identification is achieved through direct labeling on or adjacent to each pie slice.
* **Spatial Grounding:**
* The **Q1 Journals** slice (70%, dark teal) occupies the entire bottom and left portion of the chart, extending from approximately the 6 o'clock position clockwise to the 10 o'clock position.
* The **Q2 Journals** slice (25%, medium blue) occupies the top-right quadrant, from roughly 12 o'clock to 3 o'clock.
* The **Q3 Journals** slice (3%, light blue) is a very thin wedge located at approximately the 10:30 position.
* The **Q4 Journals** slice (2%, very light blue) is the thinnest wedge, adjacent to Q3 at approximately the 11 o'clock position.
### Detailed Analysis
The pie chart quantifies the share of journals for each quarter. The exact data points are:
1. **Q1 Journals:** 70% (Color: Dark Teal). This is the dominant category, representing more than two-thirds of the total.
2. **Q2 Journals:** 25% (Color: Medium Blue). This is the second-largest category, representing one-quarter of the total.
3. **Q3 Journals:** 3% (Color: Light Blue). A minor category.
4. **Q4 Journals:** 2% (Color: Very Light Blue). The smallest category.
**Trend Verification:** The visual trend is one of extreme concentration. The Q1 slice is overwhelmingly large, followed by a significant but much smaller Q2 slice. The Q3 and Q4 slices are visually negligible in comparison, appearing as thin slivers.
### Key Observations
* **Dominance of Q1:** The most striking feature is the 70% share held by Q1 Journals. This suggests a massive concentration of journal activity, publications, or submissions in the first quarter.
* **Steep Drop-off:** There is a 45-percentage-point drop from Q1 (70%) to Q2 (25%), indicating a sharp decline after the first quarter.
* **Marginal Representation of H2:** The second half of the year (Q3 and Q4) is minimally represented, combining for only 5% of the total. Q4 is the lowest at 2%.
* **Color Gradient:** The chart uses a monochromatic blue color scheme, with the slice color becoming progressively lighter as the percentage decreases (Q1: darkest, Q4: lightest). This visually reinforces the hierarchy of the data.
### Interpretation
This chart demonstrates a highly non-uniform, front-loaded distribution of journals across the year. The data suggests that the primary period for the measured journal activity (e.g., publication deadlines, submission cycles, issue releases) is overwhelmingly concentrated in Q1.
The 70% share for Q1 is an outlier compared to a more even quarterly distribution (which would be 25% each). This could indicate several underlying patterns:
* **Academic/Reporting Cycles:** Many fiscal years, grant cycles, and academic semesters begin in Q1, potentially driving a surge in related journal publications.
* **Strategic Timing:** Publishers or institutions may strategically release the majority of their content early in the year.
* **Data Collection Bias:** If the data represents a specific subset (e.g., journals from a particular field or region), it may reflect a cycle unique to that domain.
The minimal activity in Q3 and Q4 (5% combined) is notable. It implies a significant slowdown or a different operational rhythm in the latter part of the year. The chart effectively communicates that any planning, resource allocation, or analysis related to these journals must account for this extreme Q1-centricity.