# Technical Document Extraction: Pie Chart Analysis
## Chart Type
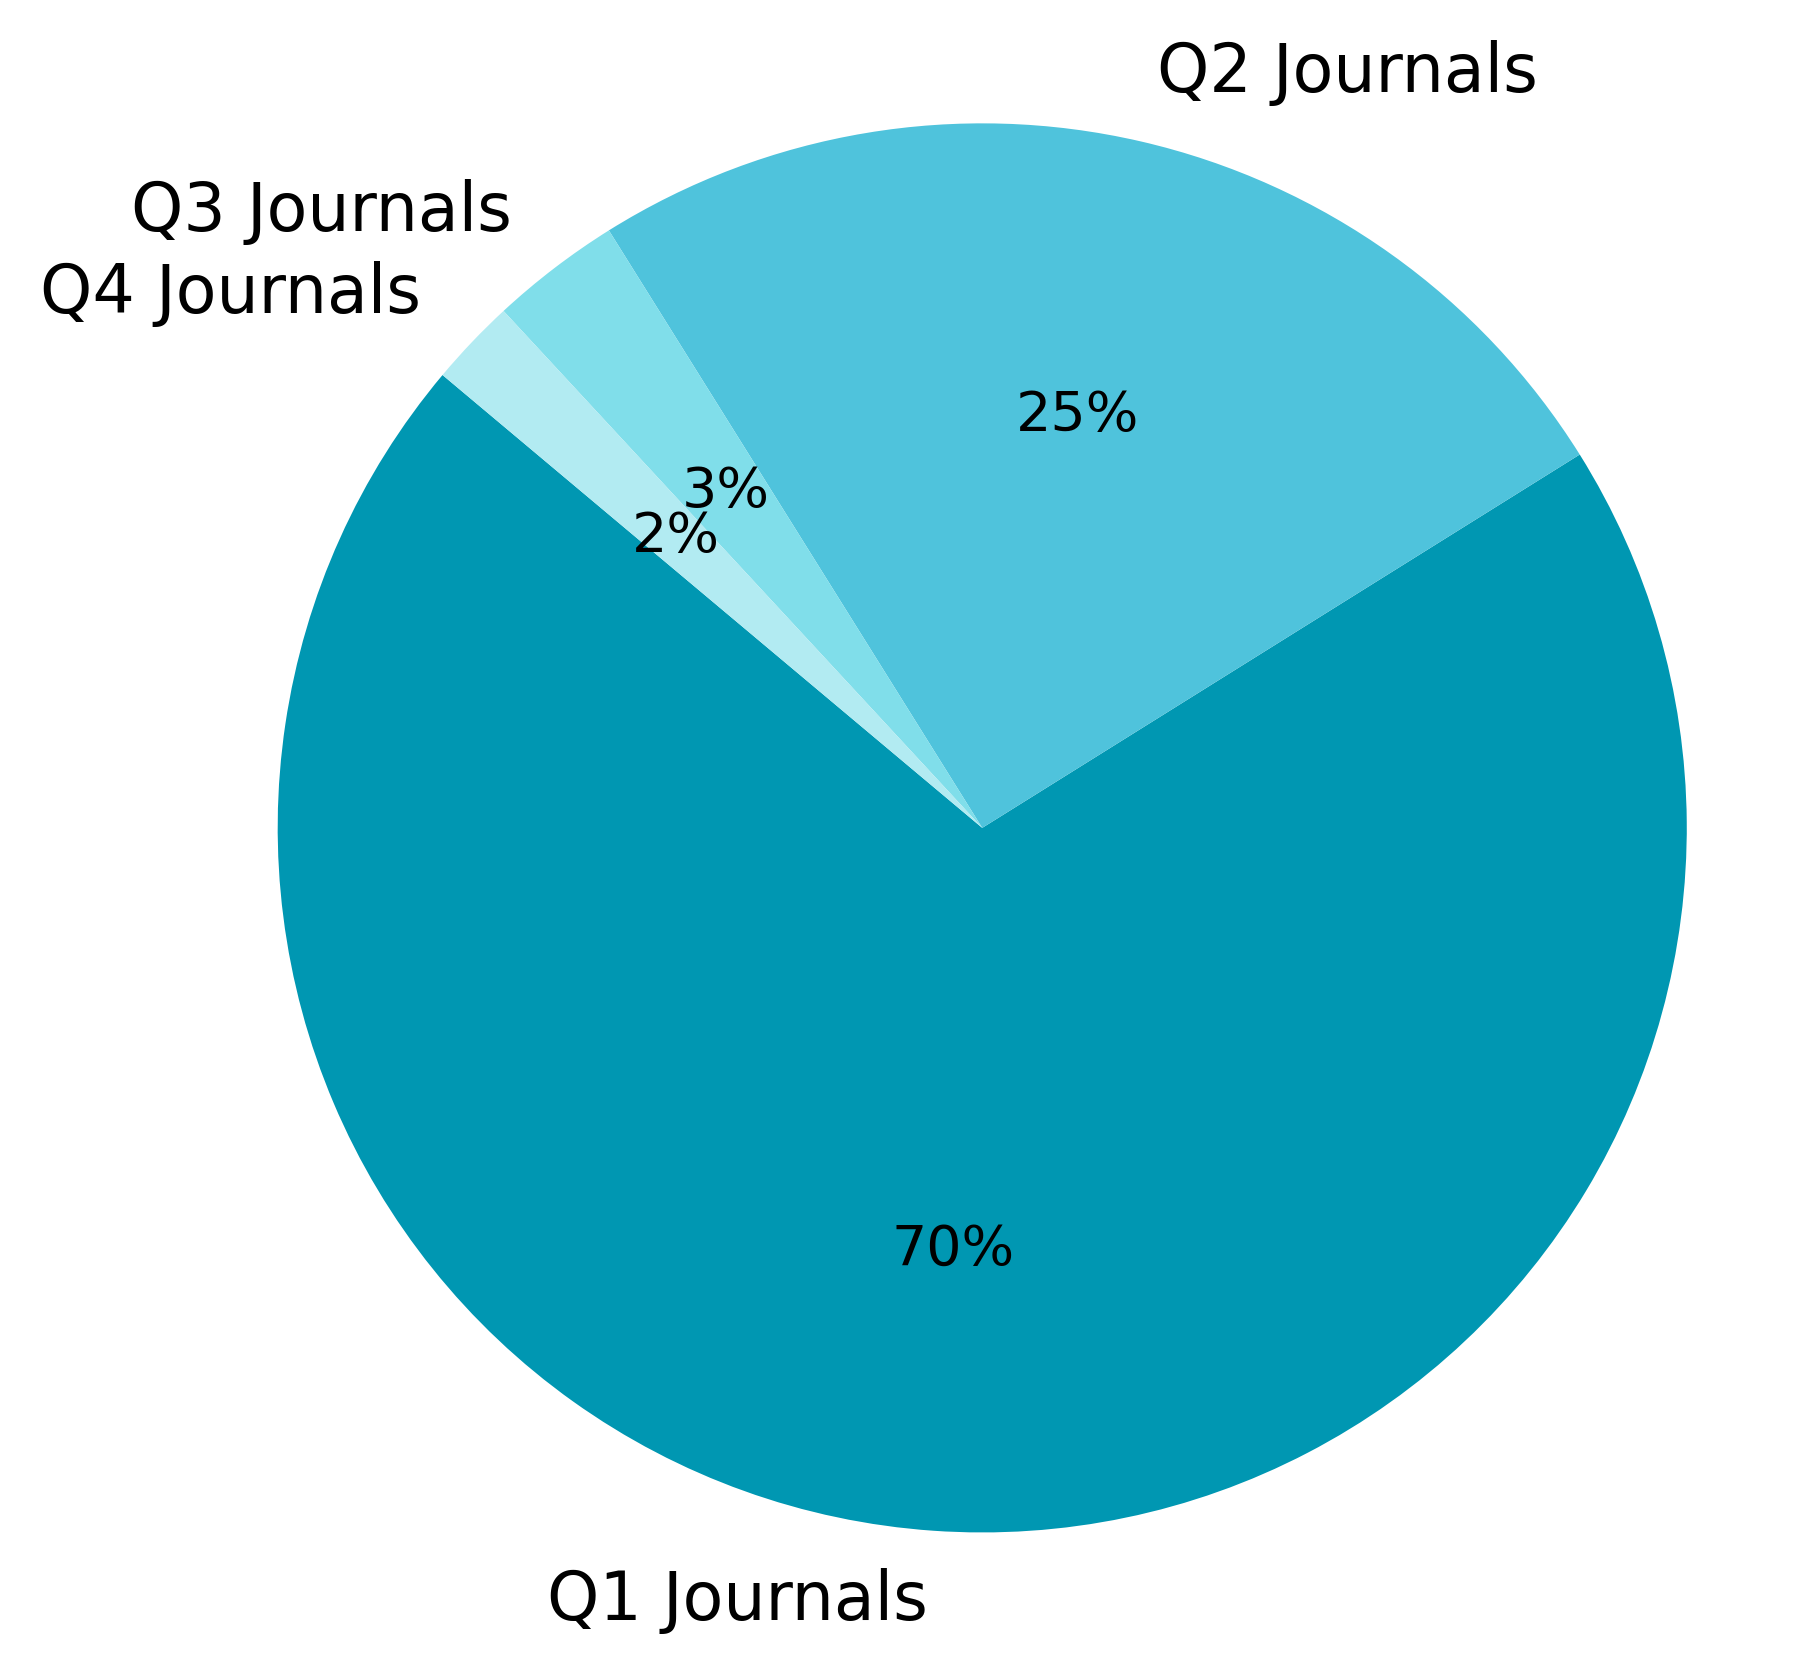
- **Pie Chart** representing quarterly journal distribution.
## Labels and Data Points
1. **Q1 Journals**
- **Color**: Dark blue (#003366)
- **Percentage**: 70%
- **Spatial Position**: Dominates the chart, occupying the majority of the circular area.
2. **Q2 Journals**
- **Color**: Medium blue (#336699)
- **Percentage**: 25%
- **Spatial Position**: Second-largest segment, adjacent to Q1.
3. **Q3 Journals**
- **Color**: Light blue (#6699CC)
- **Percentage**: 3%
- **Spatial Position**: Small segment, adjacent to Q2.
4. **Q4 Journals**
- **Color**: Very light blue (#99CCFF)
- **Percentage**: 2%
- **Spatial Position**: Smallest segment, adjacent to Q3.
## Color Legend Verification
- **Legend Integration**: Labels and colors are embedded directly into the chart (no separate legend box).
- **Color Consistency**:
- Q1 (70%) matches dark blue.
- Q2 (25%) matches medium blue.
- Q3 (3%) matches light blue.
- Q4 (2%) matches very light blue.
## Trend Verification
- **Static Distribution**: No temporal trends; represents a single snapshot of quarterly data.
- **Proportional Sizing**: Segment sizes visually align with their percentages (e.g., Q1’s 70% is the largest slice).
## Component Isolation
1. **Header**: No explicit header text; chart title inferred as "Quarterly Journal Distribution" based on labels.
2. **Main Chart**:
- Four distinct segments with labeled percentages.
- Colors transition from dark to light blue, increasing in brightness with lower percentages.
3. **Footer**: No footer text present.
## Data Validation
- **Summation Check**: 70% + 25% + 3% + 2% = 100% (validates completeness).
- **Color-Percentage Mapping**: Confirmed via spatial grounding and legend integration.
## Conclusion
The chart visually represents a distribution where Q1 Journals account for 70% of the total, followed by Q2 (25%), Q3 (3%), and Q4 (2%). Colors are systematically assigned to differentiate quarters, with no additional textual or numerical data present.