# Technical Document Extraction: Workflow Optimization Process
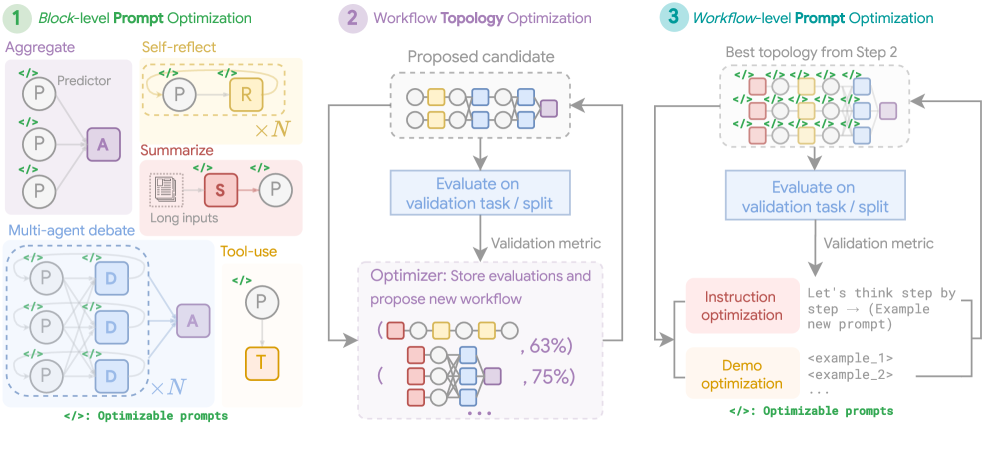
This image illustrates a three-stage technical framework for optimizing AI workflows, moving from individual block optimization to structural topology optimization, and finally to global prompt refinement.
## General Legend
* **`</>` (Green Symbol):** Represents **Optimizable prompts**.
* **P (Circle):** Predictor.
* **A (Purple Square):** Aggregator.
* **R (Yellow Square):** Reflector.
* **S (Red Square):** Summarizer.
* **D (Blue Square):** Debater.
* **T (Orange Square):** Tool.
---
## Section 1: Block-level Prompt Optimization
This section describes five common architectural patterns (blocks) where individual prompts are optimized.
### 1.1 Aggregate (Purple Box)
* **Flow:** Three Predictors (P), each with an optimizable prompt, feed into a single Aggregator (A).
* **Purpose:** Combining multiple outputs into a single result.
### 1.2 Self-reflect (Yellow Box)
* **Flow:** A Predictor (P) feeds into a Reflector (R). The Reflector provides feedback back to the Predictor in a loop.
* **Annotation:** Marked with `× N`, indicating the loop repeats $N$ times. Both components have optimizable prompts.
### 1.3 Summarize (Red Box)
* **Flow:** A "Long inputs" document icon feeds into a Summarizer (S), which then outputs to a Predictor (P).
* **Purpose:** Condensing large datasets before processing.
### 1.4 Multi-agent debate (Blue Box)
* **Flow:** A complex interconnected web of three Predictors (P) and three Debaters (D).
* **Annotation:** Marked with `× N`. The output of the debate loop feeds into an Aggregator (A).
* **Purpose:** Iterative refinement through consensus or debate.
### 1.5 Tool-use (Orange Box)
* **Flow:** A Predictor (P) with an optimizable prompt connects to a Tool (T).
---
## Section 2: Workflow Topology Optimization
This section describes the iterative process of finding the best structural arrangement of the blocks defined in Section 1.
* **Step A: Proposed candidate:** A dashed box contains a sample workflow topology (a sequence of circles and colored squares representing the blocks from Section 1).
* **Step B: Evaluation:** The candidate is sent to "Evaluate on validation task / split".
* **Step C: Metric Feedback:** A "Validation metric" is produced.
* **Step D: Optimizer:** The "Optimizer: Store evaluations and propose new workflow" block receives the metric.
* It maintains a history of topologies and their scores (e.g., a simple chain scored at **63%**, a complex parallel structure scored at **75%**).
* **Loop:** The optimizer proposes a new "Proposed candidate," repeating the cycle.
---
## Section 3: Workflow-level Prompt Optimization
Once the best structure is found, this stage performs fine-grained optimization across the entire workflow.
* **Input:** "Best topology from Step 2". The diagram shows the complex topology with green `</>` symbols over every component, indicating all prompts are now being tuned simultaneously.
* **Process:**
1. **Evaluate on validation task / split:** The workflow is tested.
2. **Validation metric:** Results are fed back for optimization.
* **Optimization Types:**
* **Instruction optimization (Pink Box):** Refines the text instructions. *Example text: "Let's think step by step → (Example new prompt)"*.
* **Demo optimization (Gold Box):** Refines the few-shot examples provided to the model. *Example text: "<example_1>, <example_2>, ..."*.
* **Loop:** The optimized instructions and demos are fed back into the "Best topology" for further iterative improvement.