\n
## Line Chart: Training and Validation Loss
### Overview
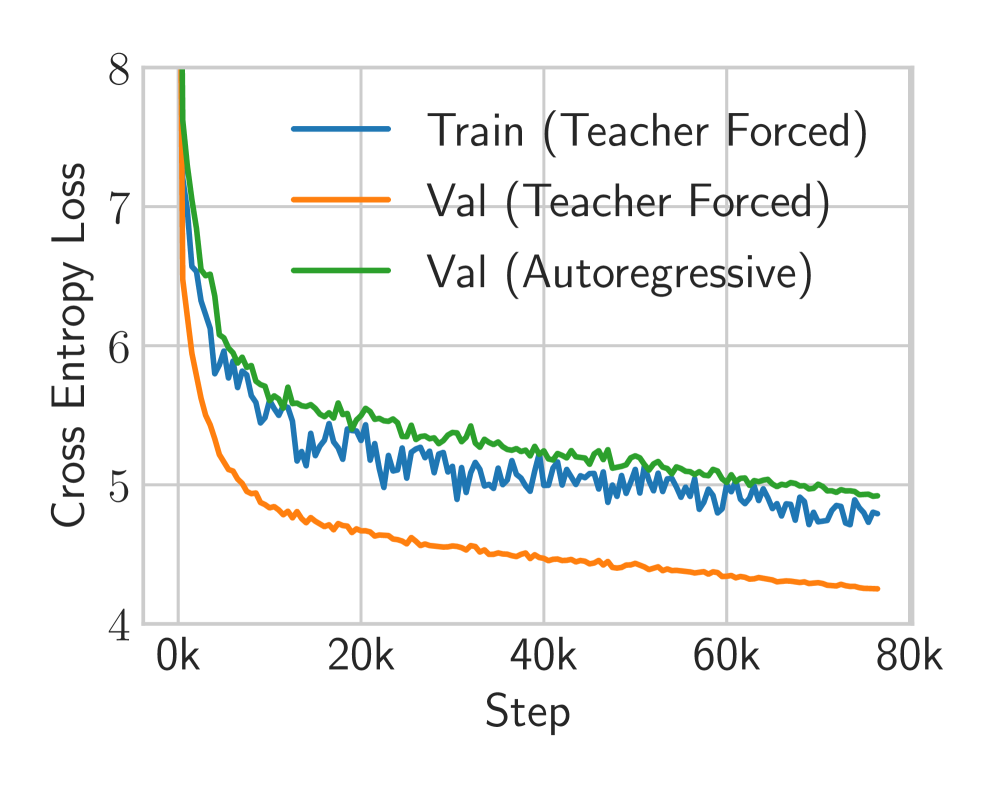
This line chart depicts the cross-entropy loss during training and validation for a model, likely a neural network. The chart tracks loss over training steps, comparing performance with and without teacher forcing, and also includes an autoregressive validation loss.
### Components/Axes
* **X-axis:** "Step", ranging from 0k to 80k, in increments of 10k.
* **Y-axis:** "Cross Entropy Loss", ranging from 4 to 8, in increments of 1.
* **Legend:** Located at the top-right of the chart.
* "Train (Teacher Forced)" - Blue line
* "Val (Teacher Forced)" - Orange line
* "Val (Autoregressive)" - Green line
* **Gridlines:** Present to aid in reading values.
### Detailed Analysis
The chart displays three lines representing different loss metrics over 80,000 training steps.
* **Train (Teacher Forced) - Blue Line:** This line starts at approximately 7.4 at Step 0k and rapidly decreases to around 4.8 by Step 10k. It then fluctuates between approximately 4.6 and 5.2 for the remainder of the training period, showing a generally stable but oscillating loss.
* Step 0k: ~7.4
* Step 10k: ~4.8
* Step 20k: ~4.9
* Step 30k: ~4.7
* Step 40k: ~4.9
* Step 50k: ~4.7
* Step 60k: ~4.8
* Step 70k: ~4.7
* Step 80k: ~4.7
* **Val (Teacher Forced) - Orange Line:** This line begins at approximately 6.2 at Step 0k and decreases more gradually than the training loss, reaching around 4.4 by Step 10k. It continues to decrease, but at a slower rate, stabilizing around 4.2-4.5 for the rest of the training.
* Step 0k: ~6.2
* Step 10k: ~4.4
* Step 20k: ~4.3
* Step 30k: ~4.2
* Step 40k: ~4.3
* Step 50k: ~4.3
* Step 60k: ~4.3
* Step 70k: ~4.3
* Step 80k: ~4.3
* **Val (Autoregressive) - Green Line:** This line starts at approximately 5.8 at Step 0k and decreases to around 5.1 by Step 10k. It then plateaus, fluctuating between approximately 5.0 and 5.3 for the remainder of the training period.
* Step 0k: ~5.8
* Step 10k: ~5.1
* Step 20k: ~5.1
* Step 30k: ~5.1
* Step 40k: ~5.2
* Step 50k: ~5.1
* Step 60k: ~5.1
* Step 70k: ~5.1
* Step 80k: ~5.1
### Key Observations
* The training loss (blue line) decreases much faster initially than the validation losses.
* The validation loss with teacher forcing (orange line) is consistently lower than the validation loss with autoregressive decoding (green line).
* All three lines appear to converge after approximately 40k steps, indicating that the model is approaching a stable state.
* The training loss exhibits more fluctuation than the validation losses, suggesting potential overfitting or sensitivity to batch variations.
### Interpretation
The chart demonstrates the training process of a model, likely a sequence-to-sequence model, using teacher forcing and autoregressive decoding. The lower validation loss achieved with teacher forcing suggests that this technique is more effective for this particular task during training. The convergence of the lines after 40k steps indicates that the model is learning and improving its performance. The difference between the validation losses highlights the impact of decoding strategy on model performance. The autoregressive validation loss being higher suggests that the model may struggle with generating sequences without the guidance of the correct previous tokens (teacher forcing). The relatively stable validation loss suggests that the model is generalizing well to unseen data, but the fluctuations in the training loss warrant further investigation to mitigate potential overfitting.