## Line Graph: Cross Entropy Loss vs Training Steps
### Overview
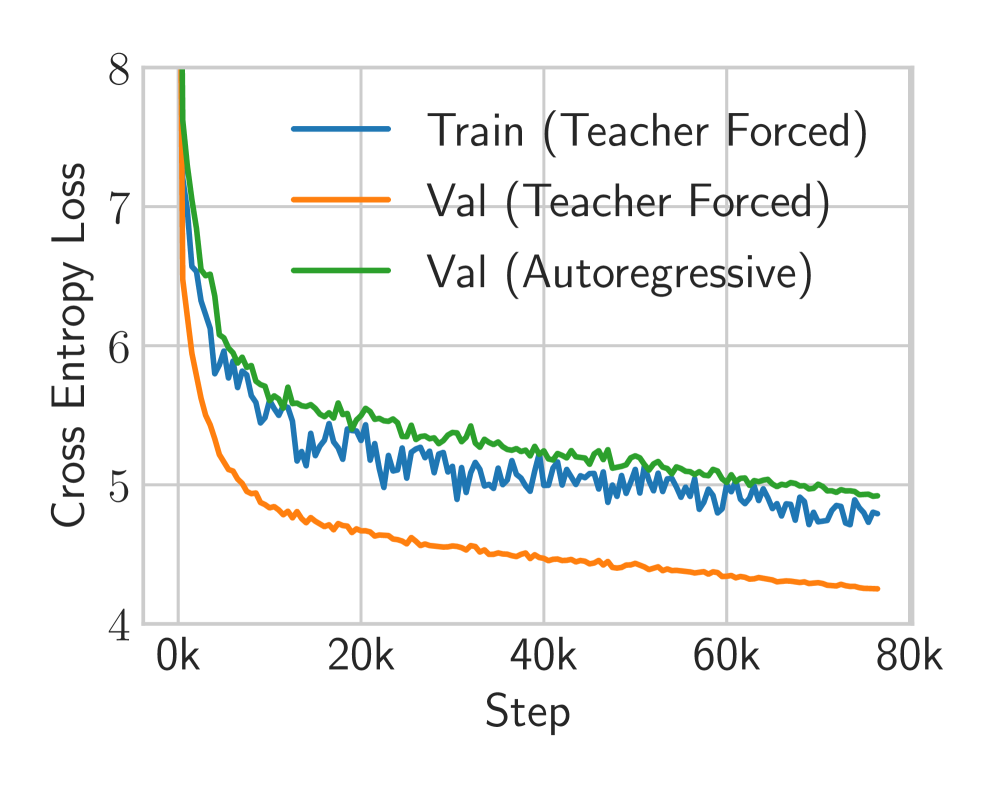
The image depicts a line graph tracking cross entropy loss across three data series during model training. The x-axis represents training steps (0k to 80k), while the y-axis shows cross entropy loss values (4 to 8). Three distinct lines represent different training/validation scenarios, with notable divergence in their trajectories.
### Components/Axes
- **X-axis (Step)**: Labeled "Step" with increments of 20k (0k, 20k, 40k, 60k, 80k)
- **Y-axis (Cross Entropy Loss)**: Labeled "Cross Entropy Loss" with increments of 1 (4 to 8)
- **Legend**: Positioned on the right side, containing:
- Blue line: "Train (Teacher Forced)"
- Orange line: "Val (Teacher Forced)"
- Green line: "Val (Autoregressive)"
### Detailed Analysis
1. **Train (Teacher Forced) [Blue Line]**
- Starts at ~8.0 at 0k steps
- Sharp decline to ~5.5 by 20k steps
- Gradual stabilization between ~5.2-5.4 from 40k-80k steps
- Final value ~4.9 at 80k steps
2. **Val (Teacher Forced) [Orange Line]**
- Begins at ~8.0 at 0k steps
- Steady decline to ~4.5 by 80k steps
- Minimal fluctuations after 40k steps
- Final value ~4.3 at 80k steps
3. **Val (Autoregressive) [Green Line]**
- Initial value ~7.5 at 0k steps
- Gradual decline to ~5.0 by 80k steps
- Consistent ~0.2-0.3 point gap above orange line throughout
- Final value ~4.8 at 80k steps
### Key Observations
- All three lines show decreasing trends, indicating improving model performance over time
- Training loss (blue) decreases faster initially than validation losses
- Validation losses (orange/green) maintain higher values than training loss, suggesting potential overfitting
- Autoregressive validation (green) consistently shows higher loss than teacher-forced validation (orange)
- All lines plateau between 4.3-5.5 loss by 80k steps
### Interpretation
The graph demonstrates typical training dynamics where the model rapidly reduces training loss (blue line) while validation losses (orange/green) decrease more gradually. The persistent gap between training and validation losses suggests possible overfitting to the training data. Notably, the autoregressive validation (green) maintains higher loss than teacher-forced validation (orange), indicating that the autoregressive approach may be less effective or that the model struggles more with autoregressive sequences. The convergence of all lines toward lower loss values after 60k steps suggests that extended training improves generalization across both training paradigms.