\n
## Chart/Diagram Type: Scatter Plot with Inset Scatter Plot & Schematic Diagrams
### Overview
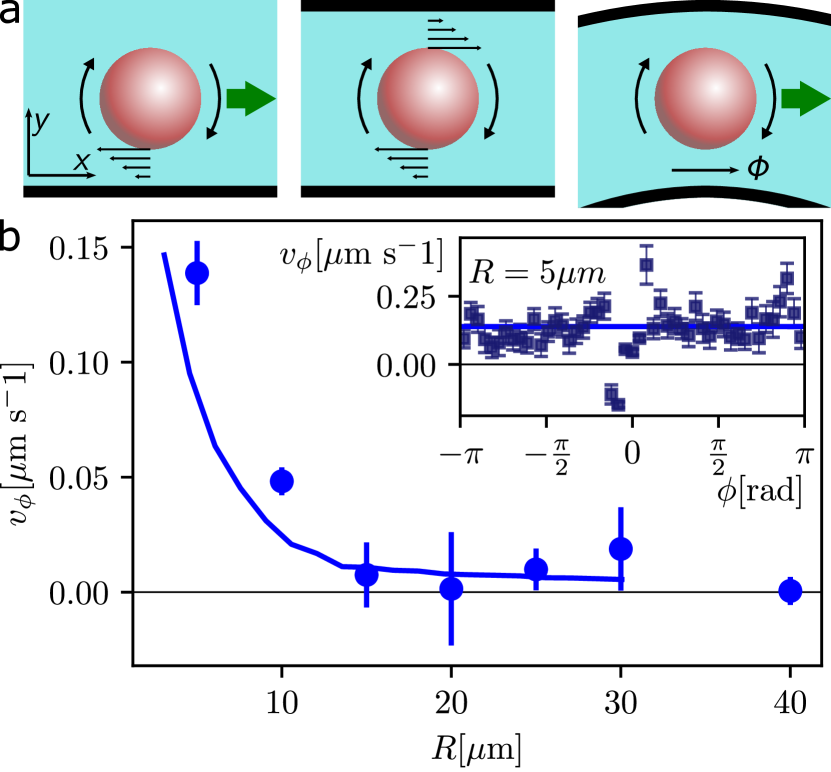
The image presents a scatter plot illustrating the relationship between particle radius (R) and tangential velocity (vφ) with error bars. An inset scatter plot shows the tangential velocity (vφ) as a function of angle (Φ). Above the main plot are three schematic diagrams depicting a particle within a fluid, with arrows indicating forces and movement.
### Components/Axes
* **Main Plot:**
* X-axis: R [µm] (Particle Radius) - Scale ranges from approximately 5 µm to 40 µm.
* Y-axis: vφ [µm/s] (Tangential Velocity) - Scale ranges from approximately -0.05 µm/s to 0.15 µm/s.
* Data Points: Blue circles with error bars.
* Trend Line: Black solid line fitted to the data points.
* **Inset Plot:**
* X-axis: Φ [rad] (Angle) - Scale ranges from -π to π.
* Y-axis: vφ [µm/s] (Tangential Velocity) - Scale ranges from approximately 0.00 µm/s to 0.25 µm/s.
* Data Points: Dark grey scatter plot.
* Horizontal Line: Black solid line at approximately vφ = 0.08 µm/s.
* **Schematic Diagrams (Top Row):**
* Three diagrams showing a particle (red circle) in a fluid (light blue background).
* Arrows indicate the direction of movement and forces.
* Labels: x, y, Φ (angle).
### Detailed Analysis or Content Details
* **Main Plot Data Points:**
* R ≈ 8 µm, vφ ≈ 0.11 µm/s (Error bar extends from approximately 0.08 µm/s to 0.14 µm/s)
* R ≈ 12 µm, vφ ≈ 0.05 µm/s (Error bar extends from approximately 0.02 µm/s to 0.08 µm/s)
* R ≈ 18 µm, vφ ≈ 0.01 µm/s (Error bar extends from approximately -0.02 µm/s to 0.04 µm/s)
* R ≈ 25 µm, vφ ≈ -0.01 µm/s (Error bar extends from approximately -0.04 µm/s to 0.02 µm/s)
* R ≈ 35 µm, vφ ≈ 0.00 µm/s (Error bar extends from approximately -0.02 µm/s to 0.02 µm/s)
* **Trend Line (Main Plot):** The black line shows a steep decrease in tangential velocity as particle radius increases from approximately 5 µm to 20 µm, then plateaus around 0 µm/s for radii greater than 20 µm.
* **Inset Plot Data Points:** The inset plot shows a relatively constant tangential velocity across all angles, with some scatter. The data points are clustered around approximately 0.08 µm/s.
### Key Observations
* The tangential velocity decreases significantly with increasing particle radius up to a certain point.
* The error bars on the main plot indicate considerable uncertainty in the measurements, particularly at smaller radii.
* The inset plot suggests that the tangential velocity is largely independent of the angle.
* The schematic diagrams illustrate the coordinate system and the angle used in the analysis.
### Interpretation
The data suggests that the tangential velocity of a particle in a fluid is strongly dependent on its size. Smaller particles experience a higher tangential velocity, while larger particles exhibit a negligible tangential velocity. This could be due to increased drag forces on smaller particles or a transition in the flow regime as the particle size increases. The inset plot indicates that the tangential velocity is not significantly affected by the particle's angular position, suggesting a symmetrical flow pattern. The error bars indicate that the measurements are noisy, which could be due to experimental limitations or inherent variability in the system. The diagrams provide a visual representation of the physical setup and the parameters being measured. The overall data suggests a relationship between particle size, tangential velocity, and fluid dynamics.