## Diagram: Sphere Motion and Velocity Analysis
### Overview
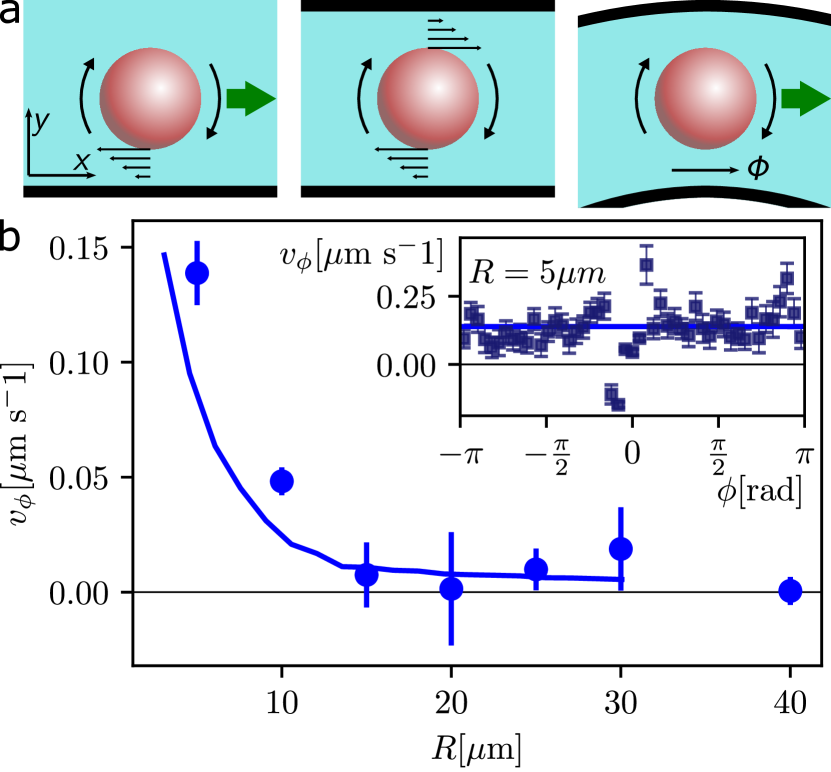
The image consists of two primary components:
1. **Three schematic diagrams** (top section) illustrating a sphere's motion and rotation in different orientations.
2. **A graph** (bottom section) showing the relationship between velocity (\(v_\phi\)) and radius (\(R\)), with an inset graph detailing angular dependence.
---
### Components/Axes
#### Top Diagrams (a)
- **Diagram 1 (Top-Left)**:
- Sphere with arrows indicating motion in the \(x\)-direction (rightward green arrow) and rotation about the \(y\)-axis (clockwise).
- Labels: \(x\), \(y\), and a green arrow labeled \(\rightarrow\).
- **Diagram 2 (Top-Middle)**:
- Sphere with arrows in \(x\)- and \(y\)-directions (horizontal and vertical black arrows).
- Green arrow labeled \(\leftarrow\) (leftward).
- **Diagram 3 (Top-Right)**:
- Sphere rotating about a vertical axis (green arrow labeled \(\phi\), counterclockwise).
- Labels: \(\phi\) (angle in radians) and \(R = 5\ \mu m\).
#### Bottom Graph (b)
- **Main Graph**:
- **X-axis**: Radius \(R\) (in \(\mu m\)), ranging from 10 to 40.
- **Y-axis**: Velocity \(v_\phi\) (in \(\mu m\ s^{-1}\)), ranging from 0 to 0.15.
- **Data**: Blue line with error bars showing a decreasing trend.
- **Legend**: Blue line labeled \(v_\phi\).
- **Inset Graph**:
- **X-axis**: Angle \(\phi\) (in radians), ranging from \(-\pi\) to \(\pi\).
- **Y-axis**: Velocity \(v_\phi\) (in \(\mu m\ s^{-1}\)).
- **Data**: Blue points with error bars, showing minimal variation except near \(\phi = \pm \pi/2\).
- **Text**: \(R = 5\ \mu m\) explicitly labeled.
---
### Detailed Analysis
#### Main Graph Trends
- The blue line decreases monotonically as \(R\) increases, with \(v_\phi\) dropping from ~0.15 \(\mu m\ s^{-1}\) at \(R = 10\ \mu m\) to ~0.00 \(\mu m\ s^{-1}\) at \(R = 40\ \mu m\).
- Error bars are smallest at \(R = 10\ \mu m\) and largest at \(R = 40\ \mu m\), suggesting increasing uncertainty with larger radii.
#### Inset Graph Trends
- \(v_\phi\) remains nearly constant (~0.00–0.05 \(\mu m\ s^{-1}\)) across \(\phi \in [-\pi, \pi]\), except for a slight dip near \(\phi = \pm \pi/2\).
- Error bars are consistent across \(\phi\), indicating stable measurements.
---
### Key Observations
1. **Radius Dependence**: \(v_\phi\) inversely correlates with \(R\), decreasing sharply for smaller radii and plateauing at larger radii.
2. **Angular Independence**: \(v_\phi\) is largely unaffected by \(\phi\), except near \(\phi = \pm \pi/2\), where minor deviations occur.
3. **Diagram Consistency**: The green arrows in the top diagrams align with the velocity direction (\(v_\phi\)) in the graph, confirming directional relationships.
---
### Interpretation
- The data suggests that the sphere's rotational velocity (\(v_\phi\)) is governed by its radius \(R\), with smaller radii enabling higher velocities. This could reflect viscous drag or geometric constraints in the system.
- The angular independence of \(v_\phi\) implies that the motion is not sensitive to orientation, except at extreme angles (\(\phi = \pm \pi/2\)), where external factors (e.g., boundary interactions) may play a role.
- The inset graph’s flat trend reinforces that \(v_\phi\) is primarily a function of \(R\), not \(\phi\).
- The error bars in the main graph highlight measurement limitations at larger radii, potentially due to experimental resolution or environmental variability.
---
**Note**: All textual labels, axis titles, and numerical values are extracted as shown. No non-English text is present.