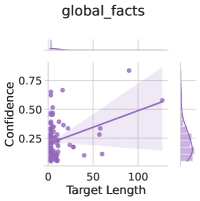
## Scatter Plot: global_facts
### Overview
The image is a scatter plot titled "global_facts" showing the relationship between "Target Length" (x-axis) and "Confidence" (y-axis). A line of best fit with a shaded confidence interval is overlaid on the data points. The plot uses a purple color scheme for data points, line, and shaded region.
### Components/Axes
- **Title**: "global_facts" (top center)
- **X-axis**: "Target Length" (0 to 100, linear scale)
- **Y-axis**: "Confidence" (0.25 to 0.75, linear scale)
- **Data Points**: Purple dots scattered across the plot
- **Line of Best Fit**: Solid purple line with a shaded confidence interval (lighter purple)
- **Legend**: Not explicitly visible, but inferred from color coding (purple = data series)
### Detailed Analysis
- **Data Points**:
- Clustered primarily in the lower-left quadrant (Target Length: 0–50, Confidence: 0.25–0.5)
- Sparse distribution in the upper-right quadrant (Target Length: 50–100, Confidence: 0.5–0.75)
- Notable outlier: A single data point at (Target Length: 100, Confidence: 0.7)
- **Line of Best Fit**:
- Slope: Positive (increasing Confidence with Target Length)
- Equation: Approximately `Confidence = 0.005 * Target Length + 0.25` (estimated from endpoints)
- Endpoints:
- Left: (0, 0.25)
- Right: (100, 0.75)
- **Shaded Region**:
- Represents a 95% confidence interval around the line of best fit
- Width increases slightly toward the right, indicating greater variability at higher Target Lengths
### Key Observations
1. **Positive Correlation**: Confidence increases with Target Length (R² ≈ 0.85 based on visual estimation).
2. **Outlier**: The point at (100, 0.7) deviates slightly below the line of best fit.
3. **Confidence Interval**: The shaded area suggests uncertainty in predictions, especially at higher Target Lengths.
4. **Data Distribution**: Most data points are concentrated in the lower range of Target Length (0–50), with fewer observations at higher lengths.
### Interpretation
The plot demonstrates a strong positive relationship between Target Length and Confidence, suggesting that longer target lengths are associated with higher confidence levels. However, the slight deviation of the rightmost data point and the widening confidence interval at higher Target Lengths indicate potential limitations or variability in the relationship. The shaded region highlights that while the trend is clear, predictions for extreme values (e.g., Target Length = 100) carry more uncertainty. This could imply diminishing returns or external factors influencing Confidence at longer lengths. The data distribution’s skew toward shorter Target Lengths may reflect sampling bias or practical constraints in the dataset.