## Scatter Plot: global_facts
### Overview
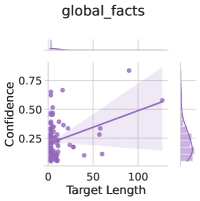
The image is a scatter plot titled "global_facts" showing the relationship between "Target Length" and "Confidence". The plot includes a regression line with a confidence interval shaded around it. Marginal distributions are shown as density plots along the x and y axes. All data points and lines are in a shade of purple.
### Components/Axes
* **Title:** global\_facts
* **X-axis:** Target Length
* Scale: 0 to 100, with tick marks at 0, 50, and 100.
* **Y-axis:** Confidence
* Scale: 0 to 0.75, with tick marks at 0, 0.25, 0.50, and 0.75.
* **Data Points:** Purple dots scattered across the plot.
* **Regression Line:** A purple line showing the linear relationship between Target Length and Confidence.
* **Confidence Interval:** A shaded purple area around the regression line, indicating the uncertainty in the line's estimate.
* **Marginal Distribution (X-axis):** A density plot above the x-axis showing the distribution of Target Length values.
* **Marginal Distribution (Y-axis):** A density plot to the right of the y-axis showing the distribution of Confidence values.
### Detailed Analysis
* **Data Points:**
* Most data points are clustered near the lower-left corner of the plot, indicating that most targets have short lengths and low confidence.
* There are a few outliers with longer target lengths and higher confidence.
* **Regression Line:**
* The regression line slopes upward, suggesting a positive correlation between Target Length and Confidence.
* The slope appears to be relatively shallow, indicating a weak positive correlation.
* **Confidence Interval:**
* The confidence interval widens as Target Length increases, indicating greater uncertainty in the regression line's estimate for longer targets.
* **Marginal Distributions:**
* The density plot for Target Length shows a strong peak near 0, indicating that most targets have very short lengths.
* The density plot for Confidence shows a peak near 0.25, indicating that most targets have low confidence.
### Key Observations
* There is a weak positive correlation between Target Length and Confidence.
* Most targets have short lengths and low confidence.
* There is greater uncertainty in the relationship between Target Length and Confidence for longer targets.
### Interpretation
The scatter plot suggests that there is a slight tendency for confidence to increase as the target length increases. However, the correlation is weak, and most data points are clustered at low target lengths and low confidence. The widening confidence interval for longer targets suggests that the relationship between Target Length and Confidence is less certain for longer targets. The marginal distributions confirm that most targets are short and have low confidence. This could indicate that the system is more reliable for shorter targets or that longer targets are more complex and therefore more difficult to assess with high confidence.