## Chart: Validation Loss vs. Tokens Seen
### Overview
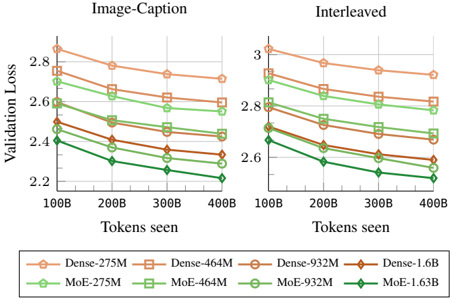
The image presents two line charts comparing the validation loss of different model architectures (Dense and MoE) with varying parameter sizes (275M, 464M, 932M, 1.6B) as a function of the number of tokens seen during training. The left chart is labeled "Image-Caption" and the right chart is labeled "Interleaved". Both charts share the same x and y axes.
### Components/Axes
* **Title (Left Chart):** Image-Caption
* **Title (Right Chart):** Interleaved
* **Y-axis Label:** Validation Loss
* Scale: 2.2 to 3.0, with tick marks at 2.2, 2.4, 2.6, 2.8, and 3.0.
* **X-axis Label:** Tokens seen
* Scale: 100B to 400B, with tick marks at 100B, 200B, 300B, and 400B.
* **Legend (Bottom):**
* Dense-275M (light brown, circle marker)
* Dense-464M (light brown, square marker)
* Dense-932M (light brown, no marker)
* Dense-1.6B (brown, diamond marker)
* MoE-275M (light green, circle marker)
* MoE-464M (light green, square marker)
* MoE-932M (light green, no marker)
* MoE-1.63B (dark green, diamond marker)
### Detailed Analysis
**Image-Caption Chart (Left)**
* **Dense-275M (light brown, circle):** Starts at approximately 2.85 at 100B tokens and decreases to approximately 2.72 at 400B tokens.
* **Dense-464M (light brown, square):** Starts at approximately 2.78 at 100B tokens and decreases to approximately 2.70 at 400B tokens.
* **Dense-932M (light brown, no marker):** Starts at approximately 2.65 at 100B tokens and decreases to approximately 2.58 at 400B tokens.
* **Dense-1.6B (brown, diamond):** Starts at approximately 2.52 at 100B tokens and decreases to approximately 2.42 at 400B tokens.
* **MoE-275M (light green, circle):** Starts at approximately 2.72 at 100B tokens and decreases to approximately 2.60 at 400B tokens.
* **MoE-464M (light green, square):** Starts at approximately 2.65 at 100B tokens and decreases to approximately 2.52 at 400B tokens.
* **MoE-932M (light green, no marker):** Starts at approximately 2.50 at 100B tokens and decreases to approximately 2.38 at 400B tokens.
* **MoE-1.63B (dark green, diamond):** Starts at approximately 2.40 at 100B tokens and decreases to approximately 2.20 at 400B tokens.
**Interleaved Chart (Right)**
* **Dense-275M (light brown, circle):** Starts at approximately 3.00 at 100B tokens and decreases to approximately 2.80 at 400B tokens.
* **Dense-464M (light brown, square):** Starts at approximately 2.88 at 100B tokens and decreases to approximately 2.75 at 400B tokens.
* **Dense-932M (light brown, no marker):** Starts at approximately 2.75 at 100B tokens and decreases to approximately 2.65 at 400B tokens.
* **Dense-1.6B (brown, diamond):** Starts at approximately 2.68 at 100B tokens and decreases to approximately 2.55 at 400B tokens.
* **MoE-275M (light green, circle):** Starts at approximately 2.80 at 100B tokens and decreases to approximately 2.70 at 400B tokens.
* **MoE-464M (light green, square):** Starts at approximately 2.72 at 100B tokens and decreases to approximately 2.60 at 400B tokens.
* **MoE-932M (light green, no marker):** Starts at approximately 2.60 at 100B tokens and decreases to approximately 2.48 at 400B tokens.
* **MoE-1.63B (dark green, diamond):** Starts at approximately 2.50 at 100B tokens and decreases to approximately 2.30 at 400B tokens.
### Key Observations
* In both charts, validation loss generally decreases as the number of tokens seen increases.
* For both Dense and MoE architectures, larger models (higher parameter counts) tend to have lower validation loss.
* The MoE-1.63B model consistently exhibits the lowest validation loss across both charts.
* The "Interleaved" chart generally shows higher validation loss values compared to the "Image-Caption" chart for all models.
### Interpretation
The charts suggest that increasing the number of tokens seen during training improves the validation loss for all models. Furthermore, larger models, particularly the MoE-1.63B model, achieve lower validation loss, indicating better performance. The difference in validation loss between the "Image-Caption" and "Interleaved" charts suggests that the training data distribution or task setup in the "Interleaved" scenario is more challenging, leading to higher loss values. The MoE models generally outperform the Dense models, indicating that the Mixture of Experts architecture is more effective for this task.