## Chart: Validation Loss vs. Tokens Seen
### Overview
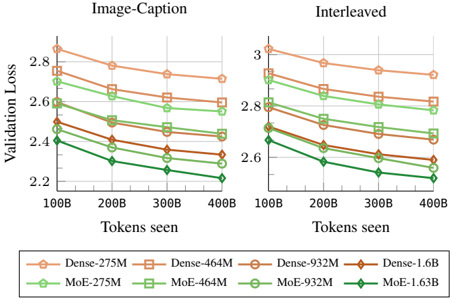
The image presents two line charts comparing validation loss against the number of tokens seen during training. The charts are titled "Image-Caption" and "Interleaved", suggesting different training methodologies. Each chart displays multiple lines, each representing a different model configuration. The x-axis represents "Tokens seen" and the y-axis represents "Validation Loss".
### Components/Axes
* **X-axis:** "Tokens seen" with markers at 100B, 200B, 300B, and 400B. (B = Billion)
* **Y-axis:** "Validation Loss" with a scale ranging from approximately 2.2 to 3.0.
* **Legend:** Located at the bottom of the image, containing the following model configurations:
* Dense-275M (Orange) - represented by a solid orange line with circle markers.
* Dense-464M (Light Orange) - represented by a dashed light orange line with square markers.
* Dense-932M (Brown) - represented by a solid brown line with circle markers.
* Dense-1.6B (Dark Orange) - represented by a solid dark orange line with diamond markers.
* MoE-275M (Green) - represented by a solid green line with circle markers.
* MoE-464M (Light Green) - represented by a dashed light green line with square markers.
* MoE-932M (Dark Green) - represented by a solid dark green line with circle markers.
* MoE-1.63B (Bright Green) - represented by a solid bright green line with diamond markers.
### Detailed Analysis or Content Details
**Image-Caption Chart:**
* **Dense-275M:** Starts at approximately 2.9, decreases to around 2.55 by 400B tokens.
* **Dense-464M:** Starts at approximately 2.8, decreases to around 2.5 by 400B tokens.
* **Dense-932M:** Starts at approximately 2.75, decreases to around 2.45 by 400B tokens.
* **Dense-1.6B:** Starts at approximately 2.85, decreases to around 2.5 by 400B tokens.
* **MoE-275M:** Starts at approximately 2.8, decreases to around 2.4 by 400B tokens.
* **MoE-464M:** Starts at approximately 2.7, decreases to around 2.35 by 400B tokens.
* **MoE-932M:** Starts at approximately 2.65, decreases to around 2.3 by 400B tokens.
* **MoE-1.63B:** Starts at approximately 2.6, decreases to around 2.2 by 400B tokens.
**Interleaved Chart:**
* **Dense-275M:** Starts at approximately 2.95, decreases to around 2.75 by 400B tokens.
* **Dense-464M:** Starts at approximately 2.9, decreases to around 2.7 by 400B tokens.
* **Dense-932M:** Starts at approximately 2.85, decreases to around 2.65 by 400B tokens.
* **Dense-1.6B:** Starts at approximately 2.9, decreases to around 2.7 by 400B tokens.
* **MoE-275M:** Starts at approximately 2.85, decreases to around 2.55 by 400B tokens.
* **MoE-464M:** Starts at approximately 2.8, decreases to around 2.5 by 400B tokens.
* **MoE-932M:** Starts at approximately 2.75, decreases to around 2.45 by 400B tokens.
* **MoE-1.63B:** Starts at approximately 2.7, decreases to around 2.35 by 400B tokens.
### Key Observations
* In both charts, all models exhibit a decreasing trend in validation loss as the number of tokens seen increases, indicating learning and improvement.
* The MoE models consistently demonstrate lower validation loss compared to their Dense counterparts across all token counts.
* Larger models (higher M/B values) generally achieve lower validation loss within each architecture type (Dense or MoE).
* The rate of loss reduction appears to slow down as the number of tokens seen increases, suggesting diminishing returns from further training.
* The "Interleaved" chart generally shows higher validation loss values than the "Image-Caption" chart for the same models and token counts.
### Interpretation
The charts compare the performance of Dense and Mixture-of-Experts (MoE) models with varying sizes (275M to 1.6B parameters) during training on two different datasets or training strategies ("Image-Caption" and "Interleaved"). The validation loss metric indicates how well the models generalize to unseen data.
The consistent outperformance of MoE models suggests that the Mixture-of-Experts architecture is more effective at capturing the complexity of the data and achieving better generalization. The larger models within each architecture type also perform better, indicating that increasing model capacity can lead to improved performance, up to a point.
The higher validation loss in the "Interleaved" chart suggests that the interleaved training strategy may be more challenging or require more data to achieve comparable performance to the "Image-Caption" strategy. This could be due to the nature of the interleaved data or the training process itself.
The diminishing returns observed at higher token counts suggest that further training may not significantly improve performance and could potentially lead to overfitting. The charts provide valuable insights into the trade-offs between model architecture, size, training strategy, and performance.