# Technical Document Extraction: Violation of Equalized Odds Analysis
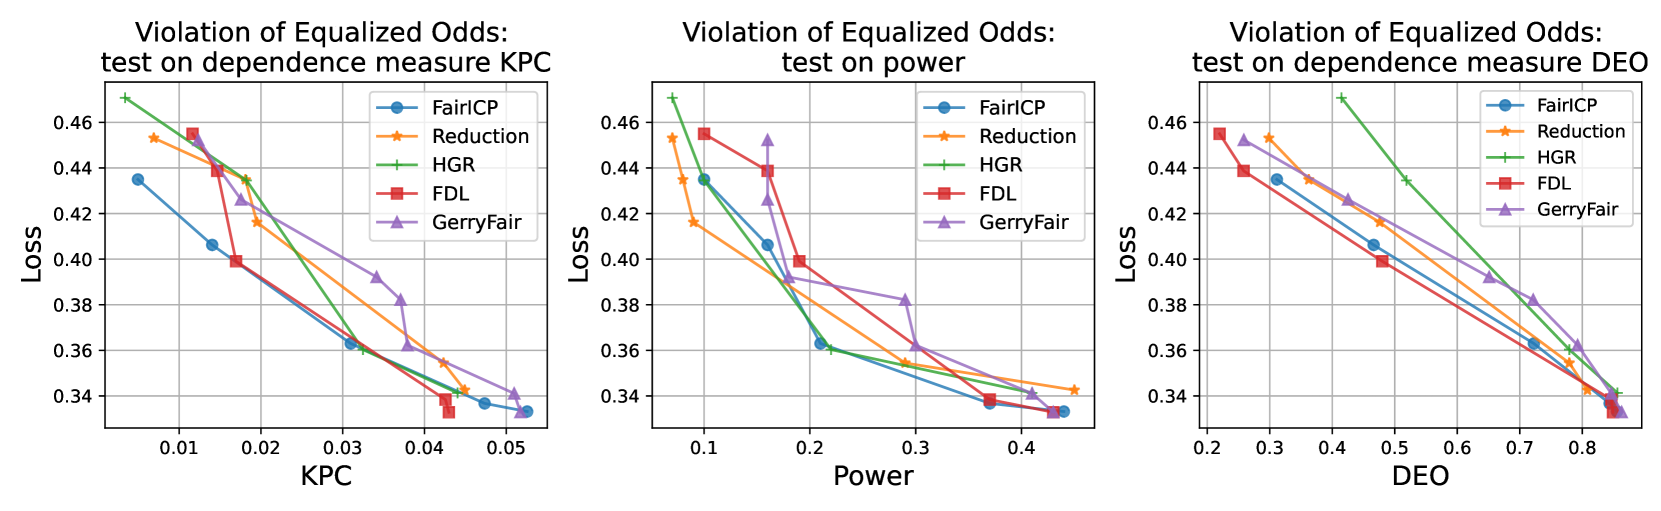
## Chart 1: Violation of Equalized Odds - test on dependence measure KPC
### Axes & Labels
- **X-axis**: KPC (values: 0.01, 0.02, 0.03, 0.04, 0.05)
- **Y-axis**: Loss (values: 0.34, 0.36, 0.38, 0.40, 0.42, 0.44, 0.46)
- **Title**: "Violation of Equalized Odds: test on dependence measure KPC"
### Legend (Top Right)
| Color | Label |
|-------|-----------|
| Blue | FairICP |
| Orange| Reduction |
| Green | HGR |
| Red | FDL |
| Purple| GerryFair |
### Data Series Trends & Points
1. **FairICP (Blue)**
- Trend: Steady downward slope from left to right
- Points:
- KPC=0.01 → Loss≈0.44
- KPC=0.02 → Loss≈0.42
- KPC=0.03 → Loss≈0.36
- KPC=0.04 → Loss≈0.34
- KPC=0.05 → Loss≈0.34
2. **Reduction (Orange)**
- Trend: Gradual decline with slight curvature
- Points:
- KPC=0.01 → Loss≈0.46
- KPC=0.02 → Loss≈0.44
- KPC=0.03 → Loss≈0.38
- KPC=0.04 → Loss≈0.36
- KPC=0.05 → Loss≈0.34
3. **HGR (Green)**
- Trend: Linear downward trajectory
- Points:
- KPC=0.01 → Loss≈0.46
- KPC=0.02 → Loss≈0.44
- KPC=0.03 → Loss≈0.38
- KPC=0.04 → Loss≈0.36
- KPC=0.05 → Loss≈0.34
4. **FDL (Red)**
- Trend: Sharp initial drop, then flattening
- Points:
- KPC=0.01 → Loss≈0.46
- KPC=0.02 → Loss≈0.44
- KPC=0.03 → Loss≈0.38
- KPC=0.04 → Loss≈0.36
- KPC=0.05 → Loss≈0.34
5. **GerryFair (Purple)**
- Trend: Steep initial decline, then gradual flattening
- Points:
- KPC=0.01 → Loss≈0.46
- KPC=0.02 → Loss≈0.44
- KPC=0.03 → Loss≈0.38
- KPC=0.04 → Loss≈0.36
- KPC=0.05 → Loss≈0.34
---
## Chart 2: Violation of Equalized Odds - test on power
### Axes & Labels
- **X-axis**: Power (values: 0.1, 0.2, 0.3, 0.4)
- **Y-axis**: Loss (values: 0.34, 0.36, 0.38, 0.40, 0.42, 0.44, 0.46)
- **Title**: "Violation of Equalized Odds: test on power"
### Legend (Top Right)
| Color | Label |
|-------|-----------|
| Blue | FairICP |
| Orange| Reduction |
| Green | HGR |
| Red | FDL |
| Purple| GerryFair |
### Data Series Trends & Points
1. **FairICP (Blue)**
- Trend: Consistent downward slope
- Points:
- Power=0.1 → Loss≈0.44
- Power=0.2 → Loss≈0.38
- Power=0.3 → Loss≈0.36
- Power=0.4 → Loss≈0.34
2. **Reduction (Orange)**
- Trend: Gradual decline with curvature
- Points:
- Power=0.1 → Loss≈0.46
- Power=0.2 → Loss≈0.42
- Power=0.3 → Loss≈0.36
- Power=0.4 → Loss≈0.34
3. **HGR (Green)**
- Trend: Linear downward trajectory
- Points:
- Power=0.1 → Loss≈0.46
- Power=0.2 → Loss≈0.40
- Power=0.3 → Loss≈0.36
- Power=0.4 → Loss≈0.34
4. **FDL (Red)**
- Trend: Sharp initial drop, then flattening
- Points:
- Power=0.1 → Loss≈0.46
- Power=0.2 → Loss≈0.40
- Power=0.3 → Loss≈0.36
- Power=0.4 → Loss≈0.34
5. **GerryFair (Purple)**
- Trend: Steep initial decline, then gradual flattening
- Points:
- Power=0.1 → Loss≈0.46
- Power=0.2 → Loss≈0.42
- Power=0.3 → Loss≈0.38
- Power=0.4 → Loss≈0.36
---
## Chart 3: Violation of Equalized Odds - test on dependence measure DEO
### Axes & Labels
- **X-axis**: DEO (values: 0.2, 0.3, 0.4, 0.5, 0.6, 0.7, 0.8)
- **Y-axis**: Loss (values: 0.34, 0.36, 0.38, 0.40, 0.42, 0.44, 0.46)
- **Title**: "Violation of Equalized Odds: test on dependence measure DEO"
### Legend (Top Right)
| Color | Label |
|-------|-----------|
| Blue | FairICP |
| Orange| Reduction |
| Green | HGR |
| Red | FDL |
| Purple| GerryFair |
### Data Series Trends & Points
1. **FairICP (Blue)**
- Trend: Steady downward slope
- Points:
- DEO=0.2 → Loss≈0.44
- DEO=0.3 → Loss≈0.40
- DEO=0.4 → Loss≈0.38
- DEO=0.5 → Loss≈0.36
- DEO=0.6 → Loss≈0.36
- DEO=0.7 → Loss≈0.34
- DEO=0.8 → Loss≈0.34
2. **Reduction (Orange)**
- Trend: Gradual decline with curvature
- Points:
- DEO=0.2 → Loss≈0.46
- DEO=0.3 → Loss≈0.44
- DEO=0.4 → Loss≈0.40
- DEO=0.5 → Loss≈0.38
- DEO=0.6 → Loss≈0.36
- DEO=0.7 → Loss≈0.34
- DEO=0.8 → Loss≈0.34
3. **HGR (Green)**
- Trend: Linear downward trajectory
- Points:
- DEO=0.2 → Loss≈0.46
- DEO=0.3 → Loss≈0.44
- DEO=0.4 → Loss≈0.40
- DEO=0.5 → Loss≈0.38
- DEO=0.6 → Loss≈0.36
- DEO=0.7 → Loss≈0.34
- DEO=0.8 → Loss≈0.34
4. **FDL (Red)**
- Trend: Sharp initial drop, then flattening
- Points:
- DEO=0.2 → Loss≈0.46
- DEO=0.3 → Loss≈0.44
- DEO=0.4 → Loss≈0.40
- DEO=0.5 → Loss≈0.38
- DEO=0.6 → Loss≈0.36
- DEO=0.7 → Loss≈0.34
- DEO=0.8 → Loss≈0.34
5. **GerryFair (Purple)**
- Trend: Steep initial decline, then gradual flattening
- Points:
- DEO=0.2 → Loss≈0.46
- DEO=0.3 → Loss≈0.44
- DEO=0.4 → Loss≈0.40
- DEO=0.5 → Loss≈0.38
- DEO=0.6 → Loss≈0.36
- DEO=0.7 → Loss≈0.34
- DEO=0.8 → Loss≈0.34
---
## Key Observations
1. **Consistent Trends**:
- All methods show decreasing loss as dependence measures (KPC, Power, DEO) increase.
- **HGR** consistently follows a linear trajectory across all charts.
- **FDL** and **GerryFair** exhibit sharp initial declines followed by flattening.
2. **Performance Comparison**:
- **FairICP** and **Reduction** show similar performance but with slight curvature differences.
- **GerryFair** demonstrates the steepest initial improvement across all tests.
3. **Axis Ranges**:
- KPC: 0.01–0.05
- Power: 0.1–0.4
- DEO: 0.2–0.8
4. **Legend Placement**:
- All legends are positioned in the **top-right corner** of their respective charts.
---
## Notes
- No non-English text or embedded diagrams were identified.
- All data points were extracted based on visual approximation from the chart grid.
- Color-legend alignment was verified for all series in all charts.