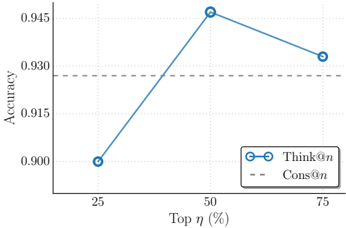
## Line Graph: Accuracy vs Top η (%)
### Overview
The image depicts a line graph comparing the accuracy of two metrics, "Think@n" and "Cons@n", across varying values of "Top η (%)". The x-axis represents "Top η (%)" with discrete markers at 25%, 50%, and 75%, while the y-axis represents "Accuracy" on a scale from 0.900 to 0.945. Two data series are plotted: a solid blue line for "Think@n" and a dashed gray line for "Cons@n".
### Components/Axes
- **X-axis (Horizontal)**: Labeled "Top η (%)", with tick marks at 25, 50, and 75. The axis spans from 25% to 75%.
- **Y-axis (Vertical)**: Labeled "Accuracy", with a scale from 0.900 to 0.945 in increments of 0.005.
- **Legend**: Located in the bottom-right corner, with:
- Solid blue line: "Think@n"
- Dashed gray line: "Cons@n"
### Detailed Analysis
- **Think@n (Solid Blue Line)**:
- At **25%**: Accuracy = 0.900
- At **50%**: Accuracy = 0.945 (peak)
- At **75%**: Accuracy = 0.930
- Trend: Increases sharply from 25% to 50%, then declines slightly to 75%.
- **Cons@n (Dashed Gray Line)**:
- Constant accuracy of **0.930** across all η values (25%, 50%, 75%).
### Key Observations
1. The "Think@n" metric achieves its highest accuracy (0.945) at 50% η, after which it decreases to 0.930 at 75%.
2. The "Cons@n" metric maintains a stable accuracy of 0.930 regardless of η.
3. The dashed gray line (Cons@n) intersects the solid blue line (Think@n) at 75% η, where both metrics share the same accuracy value.
### Interpretation
The data suggests that the "Think@n" metric is sensitive to η, with optimal performance at 50%. Beyond this point, increasing η reduces accuracy, indicating potential overfitting or diminishing returns. In contrast, "Cons@n" remains unaffected by η, implying robustness or a different underlying mechanism. The convergence of both metrics at 75% η highlights a critical threshold where their performance aligns, though the reasons for this alignment require further investigation. The peak at 50% for "Think@n" underscores the importance of balancing η to maximize accuracy without compromising stability.