\n
## Line Chart: Accuracy vs. Top η (%)
### Overview
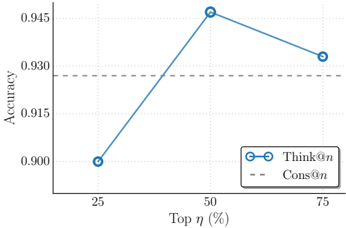
This image presents a line chart illustrating the relationship between "Top η (%)" on the x-axis and "Accuracy" on the y-axis. The chart displays the performance of a model named "Think@n" across different values of η. A horizontal dashed line represents the performance of "Cons@n".
### Components/Axes
* **X-axis:** "Top η (%)" with markers at 25, 50, and 75.
* **Y-axis:** "Accuracy" ranging from approximately 0.900 to 0.945.
* **Data Series:** "Think@n" represented by a blue line with circular markers.
* **Reference Line:** "Cons@n" represented by a grey dashed horizontal line.
* **Legend:** Located in the bottom-right corner, identifying "Think@n" with a blue line and circular marker, and "Cons@n" with a grey dashed line.
### Detailed Analysis
The "Think@n" line exhibits a clear trend: it starts at approximately 0.900 accuracy at 25% η, increases sharply to a peak of approximately 0.945 accuracy at 50% η, and then decreases to approximately 0.932 accuracy at 75% η.
Here's a breakdown of the data points:
* **η = 25%:** Accuracy ≈ 0.900
* **η = 50%:** Accuracy ≈ 0.945
* **η = 75%:** Accuracy ≈ 0.932
The "Cons@n" reference line is positioned at approximately 0.930 accuracy.
### Key Observations
* The "Think@n" model achieves its highest accuracy at η = 50%.
* The accuracy of "Think@n" surpasses the "Cons@n" baseline at all tested values of η.
* The performance gain is most significant between 25% and 50% η.
* There is a slight decrease in accuracy for "Think@n" when increasing η from 50% to 75%.
### Interpretation
The data suggests that the "Think@n" model benefits from a moderate level of η, reaching optimal performance at 50%. Increasing η beyond this point leads to a slight reduction in accuracy, although it remains above the "Cons@n" baseline. This could indicate that a higher value of η introduces more noise or irrelevant information, hindering the model's ability to make accurate predictions. The initial increase in accuracy from 25% to 50% suggests that a certain level of η is necessary to provide the model with sufficient context or information for effective decision-making. The horizontal line for "Cons@n" serves as a benchmark, demonstrating that "Think@n" consistently outperforms it across the tested range of η values. The chart highlights the importance of tuning the η parameter to optimize the performance of the "Think@n" model.