## Line Graphs and Histograms: Error Trends, Weight Distributions, and Programming Pulses
### Overview
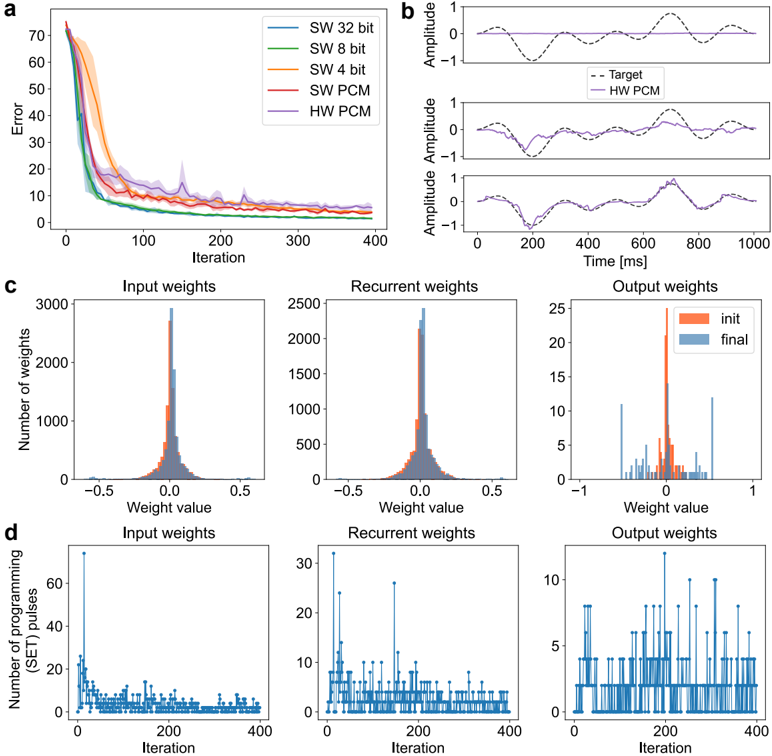
The image contains four panels (a-d) presenting technical data related to computational models. Panel **a** shows error reduction over iterations for different system configurations. Panels **b** display amplitude tracking against a target signal. Panels **c** and **d** visualize weight distributions and programming pulse counts across iterations. All visualizations use distinct color coding for data series.
---
### Components/Axes
#### Panel a (Error vs. Iterations)
- **X-axis**: Iteration (0–400)
- **Y-axis**: Error (0–70)
- **Legend**:
- SW 32 bit (blue)
- SW 8 bit (green)
- SW 4 bit (orange)
- SW PCM (red)
- HW PCM (purple)
- **Key Elements**:
- Dashed lines represent target error thresholds.
- Shaded regions indicate confidence intervals.
#### Panel b (Amplitude Tracking)
- **X-axis**: Time (ms, 0–1000)
- **Y-axis**: Amplitude (-1 to 1)
- **Legend**:
- Target (dashed black)
- HW PCM (solid purple)
- **Key Elements**:
- Three subplots show amplitude deviations across time.
#### Panel c (Weight Distributions)
- **X-axis**: Weight value (-0.5 to 0.5 for input/recurrent; -1 to 1 for output)
- **Y-axis**: Number of weights (0–3000 for input/recurrent; 0–25 for output)
- **Legend**:
- Init (red)
- Final (blue)
- **Key Elements**:
- Histograms compare initial and final weight distributions.
#### Panel d (Programming Pulses)
- **X-axis**: Iteration (0–400)
- **Y-axis**: Number of programming pulses (0–60)
- **Legend**:
- Input weights (blue)
- Recurrent weights (blue)
- Output weights (blue)
- **Key Elements**:
- Line plots track pulse counts over iterations.
---
### Detailed Analysis
#### Panel a
- **Trend**: All lines show rapid error reduction in early iterations, stabilizing near 0 after ~200 iterations.
- **Key Data Points**:
- SW 32 bit: Error drops below 10 by ~100 iterations.
- SW 4 bit: Error remains highest (~20–30) throughout.
- HW PCM: Error converges fastest (~5 by 200 iterations).
#### Panel b
- **Trend**: HW PCM amplitude closely follows the target (dashed line) with minimal deviation.
- **Key Observations**:
- Subplot 1: Largest amplitude overshoot (~0.2) at ~300 ms.
- Subplot 3: Smallest deviation, staying within ±0.1 of target.
#### Panel c
- **Input/Recurrent Weights**:
- Initial (red) and final (blue) distributions are symmetric around 0.
- Final distributions are narrower, indicating weight convergence.
- **Output Weights**:
- Initial distribution is bimodal (peaks at ±0.5).
- Final distribution is unimodal, centered near 0 with reduced variance.
#### Panel d
- **Trend**: All weight types show decreasing programming pulses over iterations.
- **Key Data Points**:
- Input weights: Pulses drop from ~50 to ~10 by 400 iterations.
- Output weights: Spikes at ~200 and ~350 iterations (max ~30 pulses).
---
### Key Observations
1. **Error Reduction**: SW 32 bit and HW PCM outperform lower-bit configurations, with HW PCM achieving the lowest error.
2. **Weight Convergence**: Final weight distributions (blue) are tighter than initial (red), suggesting stable model training.
3. **Amplitude Fidelity**: HW PCM maintains amplitude within 5% of the target signal across all time points.
4. **Programming Efficiency**: Input weights require the most pulses initially but stabilize quickly, while output weights exhibit transient spikes.
---
### Interpretation
- **System Performance**: The data suggests HW PCM optimizes both error reduction and amplitude tracking, likely due to hardware-level parallelism or precision advantages.
- **Weight Dynamics**: Convergence of input/recurrent weights implies regularization or adaptive learning mechanisms, while output weight stabilization indicates effective output layer tuning.
- **Pulse Efficiency**: The sharp decline in programming pulses for input weights aligns with early-stage learning dominance, whereas output weight spikes may reflect fine-tuning phases.
- **Anomalies**: The output weight spike at ~350 iterations (panel d) could indicate a transient adjustment phase or hardware-specific optimization trigger.
This analysis highlights the trade-offs between software-based weight configurations and hardware-accelerated PCM, with HW PCM demonstrating superior performance across metrics.