# Technical Document Extraction: 3D Scatter Plot Analysis
## Image Type
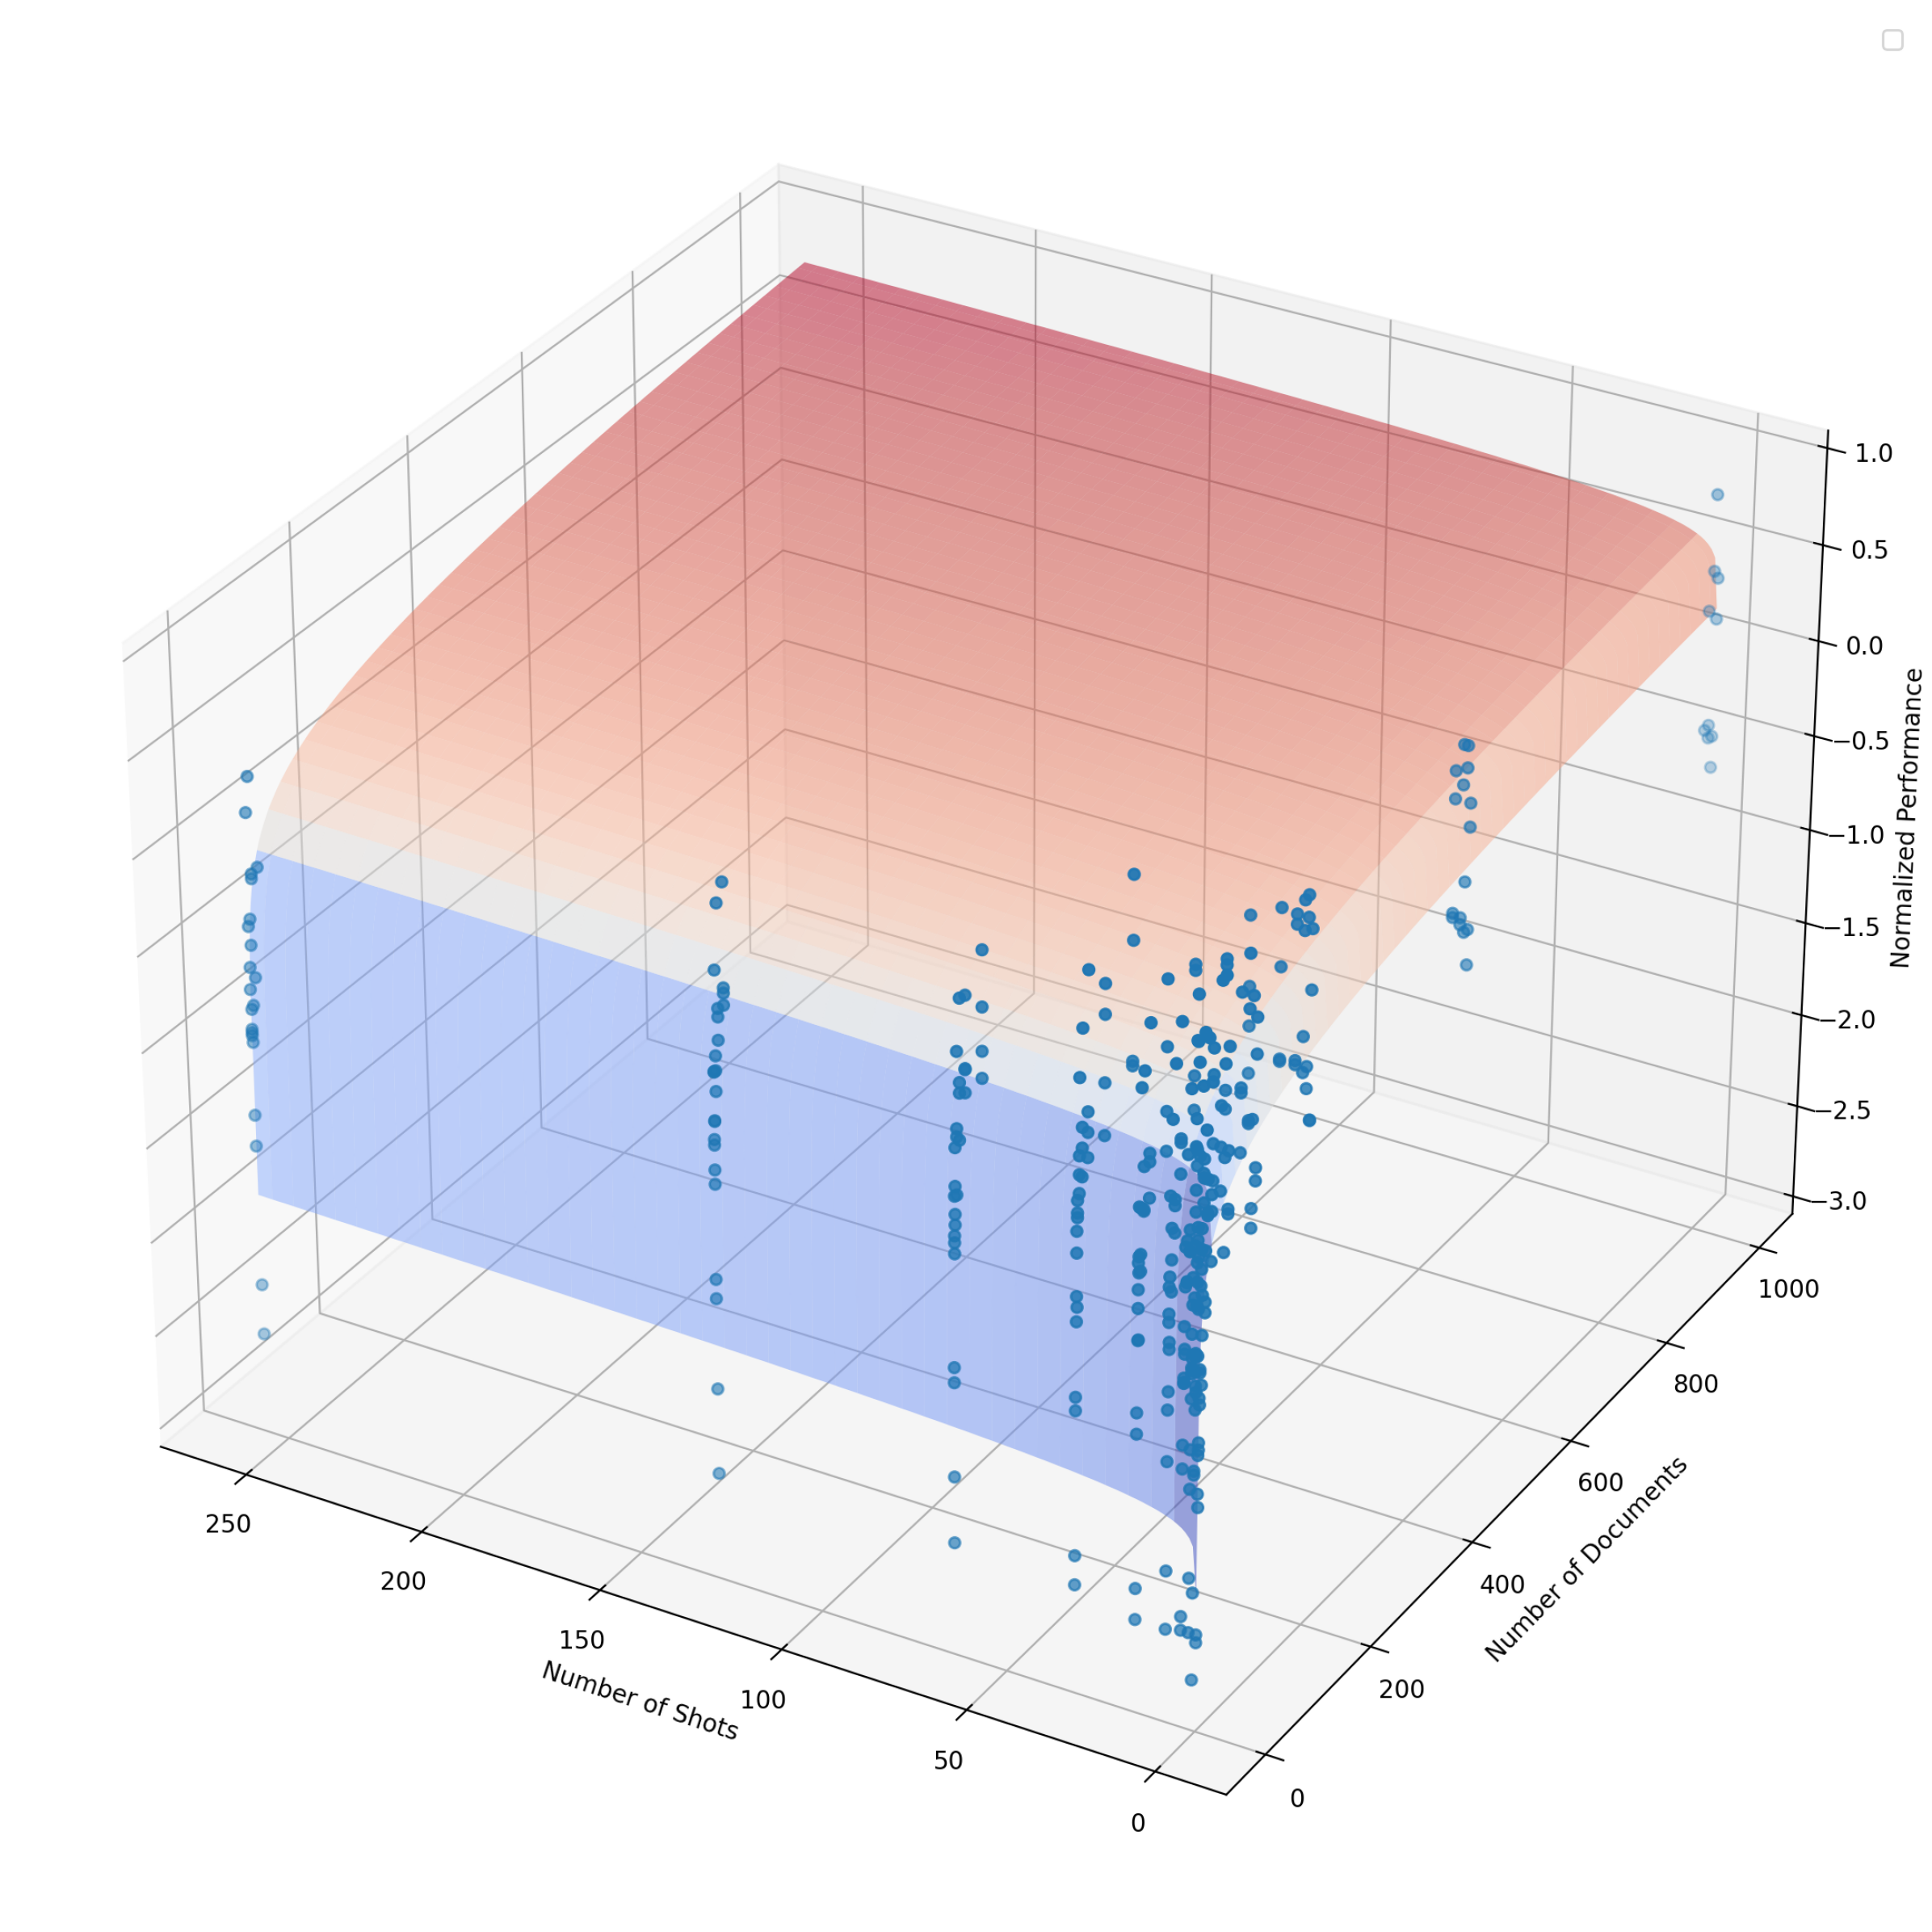
3D Scatter Plot with Surface Visualization
## Axis Labels and Markers
- **X-Axis**: Number of Documents (Range: 0–1000)
- **Y-Axis**: Number of Shots (Range: 0–250)
- **Z-Axis**: Normalized Performance (Range: -3.0–1.0)
## Legend
- **Location**: Top-right corner
- **Entries**:
- Blue Series: Blue data points
- Red Series: Red data points
## Data Series Analysis
### Blue Series
- **Visual Trend**: Clustered near the origin (low document/shots values)
- **Key Observations**:
- Points densely packed in the lower-left quadrant
- Minimal spread along the Z-axis (Normalized Performance ≈ -2.5 to -1.0)
- Spatial grounding: Most points at [x=0–50, y=0–50, z=-2.5–-1.0]
### Red Series
- **Visual Trend**: Dispersed across the plot with increasing performance
- **Key Observations**:
- Points extend toward higher document/shots values
- Z-axis values range from -1.5 to 1.0
- Notable gradient: Higher performance (Z > 0) correlates with increased document/shots counts
- Spatial grounding: Points at [x=200–1000, y=50–200, z=-1.5–1.0]
## Surface Visualization
- **Color Gradient**: Red-to-pink gradient indicating performance density
- **Key Features**:
- Darker red regions correspond to higher data point density
- Surface peaks at [x=800–1000, y=150–200, z=0.5–1.0]
- Transparency allows visibility of underlying data points
## Cross-Reference Validation
1. **Legend Colors**:
- Blue matches all blue data points (confirmed)
- Red matches all red data points (confirmed)
2. **Trend Consistency**:
- Blue series clustering aligns with low Z-values
- Red series dispersion matches increasing Z-values
## Spatial Grounding Summary
- **Blue Series**: Origin-proximal cluster ([0–50, 0–50])
- **Red Series**: Mid-to-high range distribution ([200–1000, 50–200])
- **Surface**: Overlays both series, emphasizing performance trends
## Conclusion
The plot demonstrates an inverse relationship between document/shots counts and performance for the blue series, while the red series shows a positive correlation. The surface visualization reinforces these trends through spatial density mapping.