\n
## Charts: Training and Test Loss vs. Iteration & Local Learning Coefficient vs. Iteration
### Overview
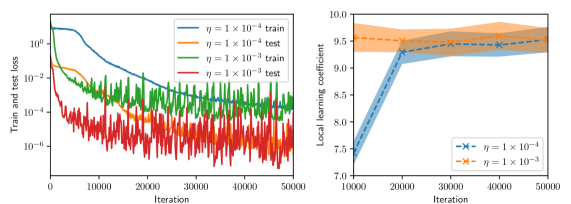
The image presents two charts side-by-side. The left chart displays the training and test loss as a function of iteration for two different learning rates. The right chart shows the local learning coefficient as a function of iteration, also for two different learning rates. Both charts are used to analyze the performance of a machine learning model during training.
### Components/Axes
**Left Chart:**
* **X-axis:** Iteration (Scale: 0 to 50000, increments of 10000)
* **Y-axis:** Train and test loss (Logarithmic scale, from approximately 1e-1 to 1e-4)
* **Legend:**
* Blue Line: η = 1 x 10<sup>-4</sup> train
* Orange Line: η = 1 x 10<sup>-4</sup> test
* Green Line: η = 1 x 10<sup>-3</sup> train
* Red Line: η = 1 x 10<sup>-3</sup> test
**Right Chart:**
* **X-axis:** Iteration (Scale: 0 to 50000, increments of 10000)
* **Y-axis:** Local learning coefficient (Scale: 7.0 to 10.0, increments of 0.5)
* **Legend:**
* Blue Dashed Line with 'x' markers: η = 1 x 10<sup>-4</sup>
* Orange Dashed Line with 'x' markers: η = 1 x 10<sup>-3</sup>
### Detailed Analysis or Content Details
**Left Chart:**
* **η = 1 x 10<sup>-4</sup> (Train - Blue):** The training loss starts at approximately 100 and decreases rapidly until around 10000 iterations, reaching a value of approximately 0.01. After 10000 iterations, the loss continues to decrease, but at a slower rate, stabilizing around 0.005 by 50000 iterations.
* **η = 1 x 10<sup>-4</sup> (Test - Orange):** The test loss starts at approximately 100 and initially decreases, but fluctuates significantly. It reaches a minimum of around 0.01 at approximately 10000 iterations, then increases and stabilizes around 0.015 by 50000 iterations.
* **η = 1 x 10<sup>-3</sup> (Train - Green):** The training loss starts at approximately 100 and decreases rapidly until around 10000 iterations, reaching a value of approximately 0.01. After 10000 iterations, the loss fluctuates significantly, with a general trend of decreasing, stabilizing around 0.005 by 50000 iterations.
* **η = 1 x 10<sup>-3</sup> (Test - Red):** The test loss starts at approximately 100 and fluctuates wildly throughout the entire training process. It generally remains higher than the training loss, with a value of approximately 0.02 at 50000 iterations.
**Right Chart:**
* **η = 1 x 10<sup>-4</sup> (Blue):** The local learning coefficient starts at approximately 7.2 and increases steadily until around 20000 iterations, reaching a value of approximately 9.2. After 20000 iterations, it plateaus around 9.2 with minor fluctuations.
* **η = 1 x 10<sup>-3</sup> (Orange):** The local learning coefficient starts at approximately 7.2 and increases steadily until around 20000 iterations, reaching a value of approximately 9.6. After 20000 iterations, it plateaus around 9.6 with minor fluctuations.
### Key Observations
* The learning rate of 1 x 10<sup>-4</sup> results in a smoother training and test loss curve compared to 1 x 10<sup>-3</sup>.
* The test loss for the learning rate of 1 x 10<sup>-3</sup> is significantly more volatile than the test loss for the learning rate of 1 x 10<sup>-4</sup>.
* The local learning coefficient increases initially for both learning rates and then stabilizes.
* The local learning coefficient is slightly higher for the learning rate of 1 x 10<sup>-3</sup> compared to 1 x 10<sup>-4</sup>.
### Interpretation
The charts demonstrate the impact of different learning rates on the training process of a machine learning model. A smaller learning rate (1 x 10<sup>-4</sup>) leads to a more stable training process, as evidenced by the smoother loss curves. However, a larger learning rate (1 x 10<sup>-3</sup>) can lead to more volatile training and test loss, potentially indicating instability or overfitting. The increase and subsequent stabilization of the local learning coefficient suggest an adaptive learning rate mechanism is being employed, which adjusts the learning rate during training to optimize performance. The higher local learning coefficient for the larger learning rate might be a compensatory mechanism to mitigate the instability caused by the larger initial learning rate. The logarithmic scale on the left chart emphasizes the significant reduction in loss achieved during training, while the linear scale on the right chart highlights the relatively small changes in the local learning coefficient. The divergence between training and test loss, particularly for the larger learning rate, suggests potential overfitting, where the model performs well on the training data but poorly on unseen data.