## Line Charts: Training/Test Loss and Local Learning Coefficient
### Overview
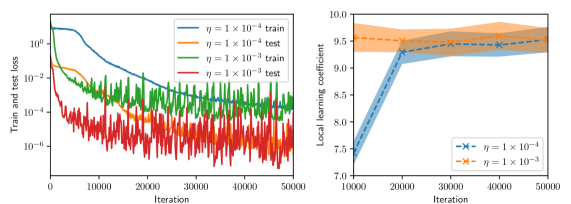
The image contains two line charts. The left chart shows training and test loss over iterations for different learning rates (η). The right chart displays the evolution of a local learning coefficient over iterations for two learning rates. Both charts use logarithmic scales for loss values and linear scales for iterations.
### Components/Axes
**Left Chart:**
- **X-axis**: Iteration (0 to 50,000)
- **Y-axis**: Train and test loss (log scale: 1e-6 to 1e0)
- **Legend**:
- Blue: η = 1 × 10⁻⁴ (train)
- Orange: η = 1 × 10⁻⁴ (test)
- Green: η = 1 × 10⁻³ (train)
- Red: η = 1 × 10⁻³ (test)
- **Legend Position**: Top-left
**Right Chart:**
- **X-axis**: Iteration (10,000 to 50,000)
- **Y-axis**: Local learning coefficient (linear scale: 7 to 10)
- **Legend**:
- Blue dashed: η = 1 × 10⁻⁴
- Orange dashed: η = 1 × 10⁻³
- **Legend Position**: Bottom-right
- **Shaded Area**: Represents uncertainty bounds around the orange line
### Detailed Analysis
**Left Chart Trends:**
1. **η = 1 × 10⁻⁴ (blue/orange)**:
- Train loss (blue) starts at ~1e-1 and decreases smoothly to ~1e-4 by 50k iterations.
- Test loss (orange) starts at ~1e-1, dips to ~1e-3 by 20k iterations, then fluctuates around ~1e-3.
2. **η = 1 × 10⁻³ (green/red)**:
- Train loss (green) starts at ~1e-1 and decreases to ~1e-4 by 50k iterations, with sharper declines.
- Test loss (red) starts at ~1e-1, drops to ~1e-4 by 20k iterations, then oscillates between ~1e-4 and 1e-3.
**Right Chart Trends:**
1. **η = 1 × 10⁻⁴ (blue dashed)**:
- Local learning coefficient starts at ~7.5, rises sharply to ~9.5 by 20k iterations, then plateaus with minor fluctuations.
2. **η = 1 × 10⁻³ (orange dashed)**:
- Local learning coefficient starts at ~9.5, remains stable with slight oscillations around ~9.5–9.7.
### Key Observations
1. **Left Chart**:
- Lower η (1e-4) shows smoother convergence but higher test loss compared to η=1e-3.
- Test loss for η=1e-3 is more volatile but achieves lower values (~1e-4) earlier.
2. **Right Chart**:
- η=1e-4 demonstrates a significant increase in local learning coefficient (~+2), while η=1e-3 remains stable.
- The shaded uncertainty band for η=1e-3 suggests higher variability in coefficient estimates.
### Interpretation
The data suggests a trade-off between learning rate and model performance:
- **η=1e-4** (smaller rate):
- Slower convergence but smoother test loss.
- Higher local learning coefficient (~9.5), indicating more efficient parameter updates.
- Potential overfitting risk (higher test loss despite smoother curves).
- **η=1e-3** (larger rate):
- Faster initial convergence but noisier test loss.
- Lower local learning coefficient (~9.5), suggesting less efficient updates.
- Better generalization (lower test loss) but with higher volatility.
The shaded uncertainty in the right chart highlights that η=1e-3's local learning coefficient estimates are less reliable. The divergence between train/test loss trends implies that η=1e-4 may prioritize training efficiency at the cost of generalization, while η=1e-3 balances speed and stability but with less predictable updates.